When Google-parent Alphabet Inc. [stckqut]GOOGL[/stckqut] reported eye-popping earnings last week its executives couldn’t stop talking up the company’s investments in machine learning and artificial intelligence.

For any other company that would be a wonky distraction from its core business. At Google, the two are intertwined. Artificial intelligence sits at the extreme end of machine learning, which sees people create software that can learn about the world. Google has been one of the biggest corporate sponsors of AI, and has invested heavily in it for videos, speech, translation and, recently, search.

For the past few months, a “very large fraction” of the millions of queries a second that people type into the company’s search engine have been interpreted by an artificial intelligence system, nicknamed RankBrain, said Greg Corrado, a senior research scientist with the company, outlining for the first time the emerging role of AI in search.

RankBrain uses artificial intelligence to embed vast amounts of written language into mathematical entities — called vectors — that the computer can understand. If RankBrain sees a word or phrase it isn’t familiar with, the machine can make a guess as to what words or phrases might have a similar meaning and filter the result accordingly, making it more effective at handling never-before-seen search queries.

Source: Google Turning Its Lucrative Web Search Over to AI Machines – Bloomberg Business

Ever since I started this site, there was concern that the market was overpriced. There are concerns about a bubble and concerns that the actions of the Fed are overheating the stock market. The concerns are typically about the P/E ratio of the general market. The price-to-earnings ratio, or P/E ratio, is an equity valuation multiple. It is defined as market price per share divided by annual earnings per share. When used for “the market” it is the combined price per share of an indicator (perhaps the S&P 500) divided by the annual earnings of those same companies.

People will try to assume that that market is overpriced based on historical norms of the P/E ratio over time.

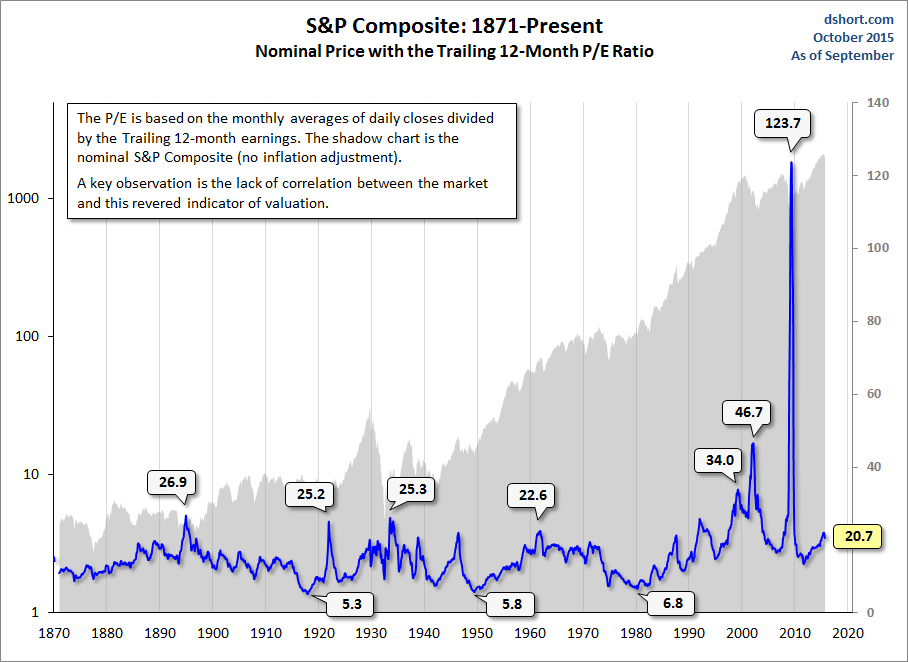
But what are historical norms worth and what is overpriced and what is cheap? The average P/E ratio since the 1870’s has been about 16.6. But the disconnect between price and TTM earnings during much of 2009 was so extreme that the P/E ratio was in triple digits — as high as the 120s — in the Spring of 2009. In 1999, a few months before the top of the Tech Bubble, the conventional P/E ratio hit 34. It peaked close to 47 two years after the market topped out. When we have had concerns with inflation or when earnings were bad, it has been at 12 or 13 times earnings and for a time in the single digits.

So we can’t look at it in a vacuum. Stocks may not be a bargain, but bonds are downright expensive. With such low natural interest, stocks need to be the investment vehicle of choice. As this graph shows, there is very little correlation between the market price and the P/E ratio.

SP-and-ttm-PE-nominal

The market is made up of pieces of paper that involve the ownership of different companies, and while there are some expensive stocks out there, we’ve got plenty of cheap ones.

I will concede that if you are investing in a company that is not currently profitable, then you are probably paying too much for that company. It is almost impossible that you can be confident in your investment in a company that is not making money.

If you follow my advice on this site, the general market P/E ratio should have little effect on your portfolio. As a Confident Investor you aren’t invested in the market, you are invested in individual companies, and we watch them to make sure that the herd mentality of the market doesn’t move against us.

Even in bad economies, the Confident Investor Rating – Good companies should continue to be good companies to own. If they aren’t, then they will quickly drop from the Good category to the Fair or Poor category!

In fact, if a stock is moving up in price then it is obviously not overpriced. Even if you believe that the general market is overpriced, that rising stock is not overpriced according to its investors.

Most investors own bonds through mutual funds or exchange-traded funds. But the household sector, including individual investors, still holds nearly $430 billion in corporate bonds, according to the Federal Reserve. If you buy bonds directly, it’s vital to keep trading costs from devouring your income, especially in today’s world of scrimpy interest rates.

Lawrence Harris, a finance professor at the University of Southern California and former chief economist at the Securities and Exchange Commission, has just completed a study of how expensive corporate bonds are to trade.

Prof. Harris analyzed bond-price quotations gleaned through Interactive Brokers Group, the deep-discount brokerage firm where he is a member of the board of directors, and trade data from the Financial Industry Regulatory Authority. He estimates that individual investors are paying bond dealers and other middlemen an average of $7.72 per $1,000 of principal value to buy corporate bonds. If you paid that much to buy stocks, 200 shares of a $50 stock would run you at least $77.20 in trading costs—instead of the roughly $10 that you would pay at most online brokerage firms.

Corporate bonds yield an average of 3.3%, according to Barclays. So Mr. Harris’s analysis suggests that trading costs consume roughly the first three months’ worth of income on the average corporate bond—assuming you pay your broker only to buy but not to sell.

Source: Huh? It Costs How Much to Trade a Bond?