Company name Alphabet Inc Class A
Stock ticker GOOGL
Live stock price [stckqut]GOOGL[/stckqut]
P/E compared to competitors Good


MANAGEMENT EXECUTION

Employee productivity Good
Sales growth Good
EPS growth Good
P/E growth Poor
EBIT growth Good
Price growth Fair
R&D growth Good
Income growth Fair
Assets growth Poor
Return on Assets growth Poor
Income / Rev growth Fair
TWCA Plus Good
Standard TWCA Good
Weighted ann. stock price increase Good


ANALYSIS

Confident Investor Rating Fair
Target stock price (TWCA growth scenario) $1741.1
Target stock price (averages with growth) $1179.74
Target stock price (averages with no growth) $1162.43
Target stock price (manual assumptions) $1463.34


The following company description is from Reuters: https://finance.yahoo.com/quote/googl/profile?p=googl

Alphabet Inc. provides online advertising services in the United States, Europe, the Middle East, Africa, the Asia-Pacific, Canada, and Latin America. It offers performance and brand advertising services. The company operates through Google and Other Bets segments. The Google segment offers products, such as Ads, Android, Chrome, Google Cloud, Google Maps, Google Play, Hardware, Search, and YouTube, as well as technical infrastructure. It also offers digital content, cloud services, hardware devices, and other miscellaneous products and services. The Other Bets segment includes businesses, including Access, Calico, CapitalG, GV, Verily, Waymo, and X, as well as Internet and television services. Alphabet Inc. was founded in 1998 and is headquartered in Mountain View, California.


Confident Investor comments: At this time, I think that a Confident Investor can cautiously invest in Alphabet Inc Class A as long as the price is correct and the indicators that I describe in my book The Confident Investor are favorable. Most of the fundamentals of this company are good but there are some concerns.

If you would like to understand how to evaluate companies like I do on this site, please read my book, The Confident Investor. You can review the best companies that I have found (and I probably invest my own money in most of these companies) in my Watch List.

How was this analysis of Alphabet Inc Class A calculated?

For owners of my book, “The Confident Investor” I offer the following analysis (you must be logged in to this site as a book owner in order to see the following analysis). If you have registered and cannot see the balance of this article, make sure you are logged in and refresh your browser.
[s2If current_user_can(access_s2member_level1)]

In order to assist you in using the techniques of this book, the values that I used when calculating the Manual pricing above were:

  • Stock price at the time of the calculation: $1448.04
  • Growth: 0.15
  • Current EPS (TTM): $43.15
  • P/E: 27.1542541313155
  • Future EPS Calc: $86.79
  • Future Stock Price Calc: $2356.71
  • Target stock price: $1463.33

[/s2If]
I hope that this makes you a Confident Investor.

In a recent Wall Street Journal article, Goldman Sachs compared the top 5 companies in 2000 to the top 5 companies today. In that comparison, Goldman concludes that the market is not repeating the problems of 2000 that caused the stock bubble in today’s market.

The top 5 companies in the S&P 500 today are:

  1. Facebook Inc.  [stckqut]FB[/stckqut],
  2. Apple Inc.  [stckqut]AAPL[/stckqut],
  3. Amazon.com Inc.  [stckqut]AMZN[/stckqut],
  4. Microsoft Corp.  [stckqut]MSFT[/stckqut],
  5. Alphabet Inc.  [stckqut]GOOGL[/stckqut].

and of 2000 were:

  1. Microsoft,
  2. Cisco Systems Inc.  [stckqut]CSCO[/stckqut],
  3. General Electric Co.  [stckqut]GE[/stckqut],
  4. Intel Corp.  [stckqut]INTC[/stckqut],
  5. Exxon Mobil Corp.  [stckqut]XOM[/stckqut].

The five companies in 2000 traded at 47 times expected earnings, according to Goldman. Today’s five biggest companies trade at 30 times expected earnings—making them by no means a bargain, but still less expensive than the stocks that dominated the stock run in the early 2000s.

The tech giants powering the S&P 500 today also reinvest far more of their profits into their businesses than their predecessors did. The five companies funnel about 48% of their cash flow from operations into capital expenditure and research and development spending, according to Goldman, well above the S&P 500’s 21% average and the 26% average for the five biggest companies in March 2000.

According to Goldman, “Lower growth expectations, lower valuations and a greater reinvestment ratio suggest the current concentration may be more sustainable than it proved to be in 2000.”


Company name Alphabet Inc Class A
Stock ticker GOOGL
Live stock price [stckqut]GOOGL[/stckqut]
P/E compared to competitors Good

MANAGEMENT EXECUTION

Employee productivity Good
Sales growth Good
EPS growth Good
P/E growth Poor
EBIT growth Good

ANALYSIS

Confident Investor Rating Good
Target stock price (TWCA growth scenario) $1710.05
Target stock price (averages with growth) $1664.23
Target stock price (averages with no growth) $1664.23
Target stock price (manual assumptions) $1724.83

The following company description is from Reuters: https://www.reuters.com/finance/stocks/company-profile/googl

Alphabet Inc., incorporated on July 23, 2015, is a holding company. The Company’s businesses include Google Inc. (Google) and its Internet products, such as Access, Calico, CapitalG, GV, Nest, Verily, Waymo and X. The Company’s segments include Google and Other Bets. The Google segment includes its Internet products, such as Search, Ads, Commerce, Maps, YouTube, Google Cloud, Android, Chrome and Google Play, as well as its hardware initiatives. The Google segment is engaged in advertising, sales of digital content, applications and cloud offerings, and sales of hardware products. The Other Bets segment is engaged in the sales of Internet and television services through Google Fiber, sales of Nest products and services, and licensing and research and development (R&D) services through Verily.

Confident Investor comments: At this price and at this time, I think that a Confident Investor can confidently invest in Alphabet Inc Class A as long as the indicators that I describe in my book The Confident Investor are favorable.

If you would like to understand how to evaluate companies like I do on this site, please read my book, The Confident Investor. You can review the best companies that I have found (and I probably invest my own money in most of these companies) in my Watch List.

How was this analysis of Alphabet Inc Class A calculated?

For owners of my book, “The Confident Investor” I offer the following analysis (you must be logged in to this site as a book owner in order to see the following analysis). If you have registered and cannot see the balance of this article, make sure you are logged in and refresh your browser.
[s2If current_user_can(access_s2member_level1)]

In order to assist you in using the techniques of this book, the values that I used when calculating the Manual pricing above were:

  • Stock price at the time of the calculation: $1106.81
  • Growth: 0.2
  • Current EPS (TTM): $39.87
  • P/E: 28
  • Future EPS Calc: $99.2
  • Future Stock Price Calc: $2777.86
  • Target stock price: $1724.83

[/s2If]
I hope that this makes you a Confident Investor.
My efforts to find great companies is primarily based on analyzing the fundamentals of each company. It is almost impossible for the average investor to directly understand the effectiveness of a company’s IT spending. Luckily, we don’t have to because that effectiveness should result in growing revenue and growing profitability (which we can directly monitor).

As you read the annual reports of companies though, an important consideration is the CEO’s comments about how IT investment is helping the company. If you fail to see this line of commentary, it should be a red flag for you. Conversely, a strong emphasis by the executives on IT spend that offers competitive advantage should at least be a signal to you to continue watching the company’s performance.

From the cited WSJ article (article may be behind a paywall):

The secret of success for Amazon, Google and Microsoft is how much they invest in their own technology.

New data suggests that the secret of the success of the Amazons, Googles and Facebook s of the world—not to mention the Walmart s, CVSes and UPSes before them—is how much they invest in their own technology. IT spending that goes into hiring developers and creating software owned and used exclusively by a firm is the key competitive advantage. It’s different from our standard understanding of R&D in that this software is used solely by the company, and isn’t part of products developed for its customers.

Source: Why Do the Biggest Companies Keep Getting Bigger? It’s How They Spend on Tech

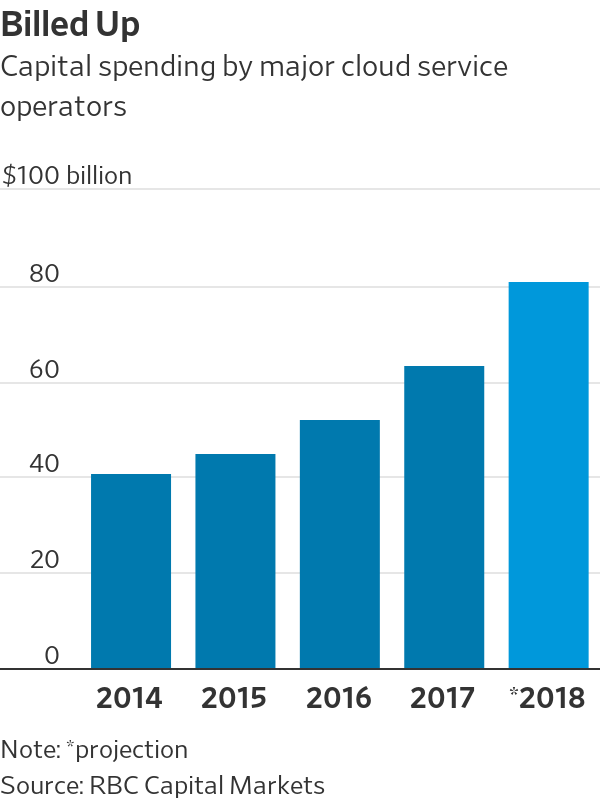
The world’s largest tech companies further their advantage by building out extensive, global networks to deliver online services to businesses and consumers. This has never been an inexpensive endeavor, but the need for further sophistication and computing power has the bills growing larger each year and there are no signs of a slowdown on the horizon.

Take, for example, the largest three U.S.-based operators of cloud computing services. Amazon.com [stckqut]AMZN[/stckqut], Microsoft [stckqut]MSFT[/stckqut], and Alphabet Inc.’s[stckqut]GOOGL[/stckqut] Google had a combined $41.6 billion in capital expenditures and capital lease deals in 2017. That is up 33% from the previous year and represents an acceleration from the 23% growth in spending seen in 2016. Not all of this goes to data-center construction, though all three have identified network expansion as a major area of focus for their capital spending plans.

Source: Cloud Bills Will Get Loftier