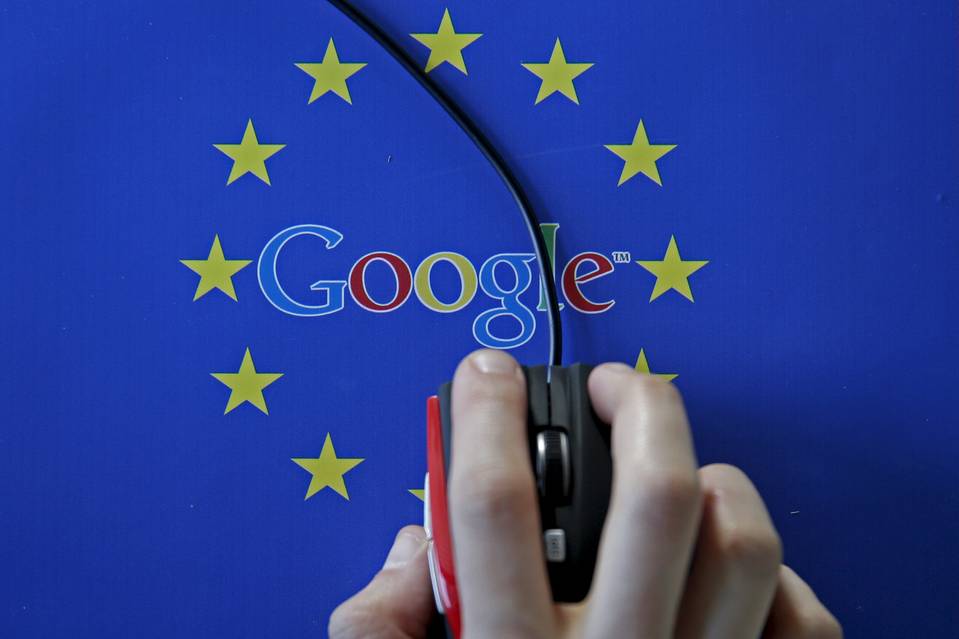
Google Inc. [stckqut]GOOG[/stckqut] on Thursday rebuffed the European Union’s demand that it change the way it ranks online comparison-shopping services in its search results, setting up a potentially drawn-out legal battle between the search giant and a regulator empowered to levy billions of euros in fines.

In a formal response Thursday to antitrust charges the EU filed this spring against the California company, Google argued the bloc’s antitrust regulators erred in their analysis of the fast-changing online-shopping business, misconstrued Google’s impact on rival shopping-comparison services, and failed to provide sufficient legal justification for its demands.

In particular, the company argues that the EU’s charges—detailed in a document called a Statement of Objections, or SO—fail to take into account the fast growth of companies like Amazon.com Inc. [stckqut]AMZN[/stckqut] and eBay Inc [stckqut]EBAY[/stckqut]. Google executives have said these firms pose a new competitive threat, which undercuts the case that Google has harmed comparison-shopping companies like Nextag and LeGuide.

Source: Google Rebuffs European Union on Antitrust Charges – WSJ

Company name eBay Inc
Stock ticker EBAY
Live stock price [stckqut]EBAY[/stckqut]
Confident Investor Rating Poor

The following company description is from Google Finance: http://www.google.com/finance?q=ebay

eBay Inc., is a global technology company. The Company enables commerce through three reportable segments: Marketplaces, Payments, and GSI. The Company by providing online platforms, tools and services to help individuals and small, medium and merchants around the globe engage in online and mobile commerce and payments, the Company can facilitate transactions. The Company also generates revenue through marketing services, classifieds and advertising. The Company has also created an open source platform that provides software developers and merchants access to its applications programming interfaces (APIs), to develop software and solutions for commerce. Its developer community includes more than 800,000 members. In December 2013, the Company announced that it has completed the acquisition of acquisition of Braintree. Effective February 19, 2014, eBay Inc acquired PhiSix Inc.
Confident Investor comments: At this price and at this time, I do not think that a Confident Investor can confidently invest in eBay Inc. It is not possible to confidently invest in a company that is not currently profitable. I am removing eBay from my Watch List.
If you would like to understand how to evaluate companies like I do on this site, please read my book, The Confident Investor.

Did you invest at the bottom of the financial crisis? This happened in March 2009. If you did invest at the bottom, you would have enjoyed a massive multi-year bull market.

The above video does a great job of pointing out the benefits of simply investing in an index fund in the equity market. It also points out the fallacy of just leaving your money in a savings account.

Several times, I have pointed out that the system that I describe in my book, The Confident Investor, actually would allow you to avoid the massive downfall in  late 2008 and early 2009. When I published the trade-by-trade analysis of The Boston Beer Company [stckqut]SAM[/stckqut], Decker Corporation [stckqut]DECK[/stckqut], and eBay [stckqut]EBAY[/stckqut], I intentionally chose a time frame that included this massive drop. As you can see by analyzing my trades during that time, I avoided the worst of the drop as my system sensed the downturn and kept my money safe.

Click through to those articles of SAM, DECK, and EBAY and you will see how efficient my system is at preserving capital and allowing you to increase your wealth over a simply buy and hold strategy. I also wrote an article about how my system works really well at finding the best companies and beating the market by 95%, if you invest at the bottom or just buy at a short-term bottom.

My system helps you to invest at the bottom of the market and avoid losing money as the market drops. For stocks that go up and down in price, it is incredibly efficient. You can almost guarantee that there will be another opportunity to invest at the bottom of a stock. Are you prepared for getting out of your stock investments before it hits bottom? Are you setup to invest at the bottom?

You can purchase my book wherever books are sold such as AmazonBarnes and Noble, and Books A Million. It is available in e-book formats for NookKindle, and iPad.

In a 8 year time frame from January 3, 2006 to December 31, 2013, eBay [stckqut]EBAY[/stckqut] increased 38.4% if you would have implemented a pure buy-and-hold strategy. If you would implement the investing system that I explain in my book, The Confident Investor, you would have seen a 253.2% return on your investment. This is a 658.8% increase on the profit percentage.

To put it into actual dollars, suppose you invested $10,000 in eBay on 1/3/2006. With the investing system that is explained in The Confident Investor, you would have exited the market on 12/31/2013 with $47,522.94 . With my investing system, it is not uncommon for you to need a bit more cash available to cover the ongoing trades. Therefore, rather than $10,000, you would have needed $13,454.01. You would have 689 shares which were purchased with other people’s money and still have your original $10,000.

To be fair in our comparison, the buy-and-hold investing system if calculated with $13,454.01 would have ended up with  $18,625.32  and a respectable 38.4%. You would have purchased 342 shares but your original $13,454.01 would be tied up in the stock and not available for other investments.

The profit on the buy-and-hold investing system in this scenario is  $18,625.32 .  The profit using my investing system, GOPM (Grow on Other People’s Money), is  $47,522.94.  That means the increased profit on eBay in this time frame was $28,897.62 . This means your profit INCREASED by 253%!!

Understanding the differences in the investing system

Understanding buy-and-hold investing system is easy. You have a given amount of money, in this case $13,454.01. You buy 342 shares at the start of the test period. At the end of the test period, you sell the shares and the profit (or loss) is the standard that any other system must beat.

Understanding the GOPM investing system is a bit more complicated without reading my book, The Confident Investor. Before you even start to invest, the investing system teaches you to look for incredibly well-run companies and only invest in those companies. While eBay may or may not have qualified for this status in 2006, it does in 2014 so we are simply back-testing against a currently well-run company. While past performance doesn’t guarantee future performance, it is probably the best tool that we have to understand investment methodologies.

After you find a well-run company, you are going to buy $10,000 worth of shares when the technical indicators tell you that the stock has upward momentum. You are then going to sell those shares when that momentum slows down or reverses.  The profit that you make on that transaction, you will keep in the stock (in other words, you are not going to sell those shares). You are going to keep the $10,000 ready for when the stock has the correct momentum. If there is any excess profit (e.g. less than the value of a full share after keeping the $10,000) you will just stick that into your money-market account in this example. It is possible that you could invest this excess amount but we are going to simplify this example and just hold that money.

As a quick example, you invest $10,000 in a stock trading at $50 per share so you have purchased 200 shares.  Over the course of the next several days or weeks, the stock price increases to $55 which is where you decide to sell. To get your original capital of $10,000 back, you sell 182 shares resulting in $10,010 in your account and 18 shares that are essentially free since they were purchased with Other People’s Money. You now have your original capital of $10,000, 18 free shares and an additional $10.

Using this investing system, you will make several trades per year and may even be trading weekly. Therefore, to make this model fair, I need to account for stockbroker fees and commissions.  In this example, I am using $8 for every sell and for every purchase. You may have a better fee from your favorite broker but $8 seems fair for a test. Frankly, if you are paying more than $10 for each transaction then you probably need to be looking at another broker!

Using this technique, by the end of the test on 12/31/2013 you would have 689 shares of eBay that cost you $3,454.01. Those 689 shares were acquired for $5.013 per share! This is significantly cheaper than today’s stock price and no matter what happens to eBay you could probably sell these shares for a profit at any time! You would still have the original $10,000 in your bank account! This is because you have purchased these share with Other People’s Money.  This is why I call my investing system GOPM – Grow on Other People’s Money.

If you would have invested in eBay as described in this article, you would have doubled your investment by November 12, 2010.

The rest of this article shows each buy and sell transaction for those 8 years. It shows the date, the assumed purchase price on that day (taken from Yahoo – the purchase price is the average of the opening and closing price on that day) and the profit or loss. If you haven’t read my book, The Confident Investor, then you may not understand the timing of the trades. In fact, if you haven’t purchased the book and registered here on this site as a book owner then you won’t be able to see those individual trades. If you have registered and cannot see the trades, make sure you are logged in and refresh your browser.

Which brings me to the big set of questions. Shouldn’t you own this book? Does your investing system beat buy-and-hold? Do you even have a strategy for your investment system? If your strategy beats buy-and-hold, does it beat GOPM – Growing on Other People’s Money?

You can purchase my book wherever books are sold such as AmazonBarnes and Noble, and Books A Million. It is available in ebook formats for NookKindle, and iPad. It may be available at your favorite bookstore as well but you may have to ask.

eBay 8 year chart from Google Finance

eBay 8 year chart


[s2If current_user_can(s2member_level1)]

Description of eBay trades table

While it may be obvious the meaning of the various columns, some of them definitely need a bit of explanation if you have never walked through a trading analysis with me.

Date – The date of the trade. It is important to note the long delays between trades. This will help you with your portfolio since you do not have to dedicate your average trade purchase (in this case $10,000) to just one stock but rather you can invest that money in the hottest stock at the time.

Buy/Sell – This is probably pretty obvious. On this date, did the system buy or sell the stock? The SELL will only sell from the previous transaction’s BUY.

Purch. Price – The selling or buying price of this transaction. This is taken from Yahoo’s Historical Pricing page and it is the average of the opening and closing price on that day.

Shares purchased – The number of shares that $10,000 will buy on that day.

Invested – The amount that was actually purchased. This is the number of shares (the previous column) multiplied by the Purch. Price column.

Returned – When you sell the shares from the previous BUY, the amount of money that results.

Profit/Loss – How much was profited from the previous BUY.

Free shares – If the SELL was profitable, how many shares was evenly divides into this profit.  These are free shares as they were purchased with Other People’s Money.

Excess – After the Free Shares are taken out, how much money is left over. If the transaction was not profitable, then what was the loss.

Running investment balance – A running total of the value of the investment.


eBay trades table


Date Action Purchase price Shares purch. Invested Returned Profit / Loss Free Shares Excess Running
investment balance
1/5/06 BUY $45.30 220 $9,966.00 $-
1/11/06 SELL $45.61 $10,025.10 $59.10 1 $13.50 $13
4/19/06 BUY $40.01 249 $9,962.49 $13
4/20/06 SELL $37.32 $9,283.44 $(679.06) $(679.06) $(666)
8/21/06 BUY $26.92 371 $9,985.47 $(666)
8/24/06 SELL $26.09 $9,669.54 $(315.93) $(315.93) $(981)
8/29/06 BUY $26.58 375 $9,967.50 $(981)
9/15/06 SELL $28.08 $10,522.00 $554.50 19 $20.98 $(961)
9/28/06 BUY $27.84 358 $9,964.93 $(961)
11/27/06 SELL $32.74 $11,712.92 $1,747.99 53 $12.77 $(948)
12/15/06 BUY $32.95 303 $9,982.34 $(948)
12/19/06 SELL $32.16 $9,734.97 $(247.37) $(247.37) $(1,195)
1/29/07 BUY $31.75 314 $9,969.50 $(1,195)
2/26/07 SELL $33.85 $10,620.90 $651.40 19 $8.25 $(1,187)
3/29/07 BUY $33.21 300 $9,963.00 $(1,187)
4/30/07 SELL $34.19 $10,249.00 $286.00 8 $12.48 $(1,174)
5/8/07 BUY $34.09 293 $9,986.91 $(1,174)
5/14/07 SELL $34.26 $10,030.18 $43.28 1 $9.02 $(1,165)
7/3/07 BUY $32.30 309 $9,979.16 $(1,165)
7/19/07 SELL $33.58 $10,366.68 $387.52 11 $18.20 $(1,147)
8/6/07 BUY $34.13 292 $9,965.96 $(1,147)
8/14/07 SELL $34.96 $10,200.32 $234.36 6 $24.60 $(1,123)
9/5/07 BUY $34.75 287 $9,973.25 $(1,123)
10/18/07 SELL $38.17 $10,946.79 $973.54 25 $19.29 $(1,103)
12/12/07 BUY $34.37 290 $9,965.85 $(1,103)
12/14/07 SELL $33.27 $9,638.85 $(327.00) $(327.00) $(1,430)
3/20/08 BUY $28.08 355 $9,966.63 $(1,430)
4/11/08 SELL $31.18 $11,059.13 $1,092.50 35 $1.37 $(1,429)
5/14/08 BUY $31.26 319 $9,971.94 $(1,429)
5/19/08 SELL $31.04 $9,893.76 $(78.18) $(78.18) $(1,507)
12/12/08 BUY $13.94 717 $9,991.40 $(1,507)
12/22/08 SELL $14.29 $10,237.93 $246.54 17 $3.61 $(1,503)
1/2/09 BUY $14.35 696 $9,984.12 $(1,503)
1/9/09 SELL $14.41 $10,017.88 $33.76 2 $4.95 $(1,499)
2/10/09 BUY $13.52 739 $9,991.28 $(1,499)
2/17/09 SELL $12.52 $9,244.28 $(747.00) $(747.00) $(2,246)
3/24/09 BUY $12.76 783 $9,991.08 $(2,246)
5/13/09 SELL $16.50 $12,907.59 $2,916.51 176 $13.39 $(2,232)
6/1/09 BUY $18.06 553 $9,984.42 $(2,232)
6/8/09 SELL $17.75 $9,804.99 $(179.43) $(179.43) $(2,412)
9/10/09 BUY $23.25 429 $9,972.11 $(2,412)
9/23/09 SELL $24.09 $10,326.61 $354.51 14 $17.25 $(2,394)
10/7/09 BUY $24.13 414 $9,987.75 $(2,394)
10/16/09 SELL $24.78 $10,248.85 $261.10 10 $13.35 $(2,381)
11/30/09 BUY $23.84 419 $9,988.96 $(2,381)
12/3/09 SELL $23.76 $9,947.44 $(41.52) $(41.52) $(2,423)
1/25/10 BUY $23.70 421 $9,977.70 $(2,423)
1/28/10 SELL $23.67 $9,954.97 $(22.74) $(22.74) $(2,445)
2/24/10 BUY $23.18 431 $9,988.43 $(2,445)
3/24/10 SELL $26.96 $11,611.76 $1,623.34 60 $5.73 $(2,440)
7/26/10 BUY $21.07 474 $9,984.81 $(2,440)
9/16/10 SELL $24.06 $11,396.44 $1,411.63 58 $16.15 $(2,423)
10/14/10 BUY $25.15 397 $9,984.55 $(2,423)
11/12/10 SELL $30.37 $12,048.89 $2,064.34 67 $29.55 $(2,394)
12/10/10 BUY $30.60 326 $9,973.97 $(2,394)
12/15/10 SELL $30.46 $9,921.96 $(52.01) $(52.01) $(2,446)
1/21/11 BUY $30.39 328 $9,966.28 $(2,446)
2/22/11 SELL $33.89 $11,107.92 $1,141.64 33 $23.27 $(2,423)
4/6/11 BUY $31.99 312 $9,980.88 $(2,423)
4/8/11 SELL $31.37 $9,779.44 $(201.44) $(201.44) $(2,624)
4/20/11 BUY $31.68 315 $9,979.20 $(2,624)
5/4/11 SELL $33.18 $10,443.70 $464.50 13 $33.16 $(2,591)
7/19/11 BUY $33.42 298 $9,959.16 $(2,591)
7/28/11 SELL $33.29 $9,912.42 $(46.74) $(46.74) $(2,638)
9/15/11 BUY $31.52 317 $9,990.26 $(2,638)
9/28/11 SELL $32.19 $10,196.23 $205.97 6 $12.83 $(2,625)
10/10/11 BUY $32.00 312 $9,982.44 $(2,625)
10/20/11 SELL $31.99 $9,972.88 $(9.56) $(9.56) $(2,634)
11/4/11 BUY $32.69 305 $9,970.45 $(2,634)
11/9/11 SELL $31.68 $9,654.40 $(316.05) $(316.05) $(2,950)
12/12/11 BUY $31.20 320 $9,982.40 $(2,950)
12/14/11 SELL $30.70 $9,816.00 $(166.40) $(166.40) $(3,117)
1/19/12 BUY $31.40 318 $9,985.20 $(3,117)
1/31/12 SELL $31.68 $10,064.65 $79.45 2 $16.10 $(3,101)
2/6/12 BUY $32.67 305 $9,964.35 $(3,101)
3/6/12 SELL $35.22 $10,734.10 $769.75 21 $30.13 $(3,071)
3/13/12 BUY $36.81 271 $9,975.51 $(3,071)
3/28/12 SELL $37.51 $10,157.21 $181.70 4 $31.66 $(3,039)
4/23/12 BUY $39.52 252 $9,959.04 $(3,039)
5/4/12 SELL $39.70 $9,995.14 $36.10 0 $36.10 $(3,003)
5/29/12 BUY $41.03 243 $9,970.29 $(3,003)
5/30/12 SELL $40.37 $9,800.70 $(169.60) $(169.60) $(3,172)
6/6/12 BUY $40.47 246 $9,955.62 $(3,172)
6/13/12 SELL $40.52 $9,958.69 $3.07 0 $3.07 $(3,169)
6/20/12 BUY $43.20 231 $9,978.05 $(3,169)
6/25/12 SELL $42.03 $9,699.78 $(278.27) $(278.27) $(3,448)
7/23/12 BUY $44.00 227 $9,988.00 $(3,448)
8/9/12 SELL $44.67 $10,130.96 $142.96 3 $8.96 $(3,439)
8/17/12 BUY $46.56 214 $9,963.84 $(3,439)
8/30/12 SELL $46.88 $10,024.32 $60.48 1 $13.60 $(3,425)
9/6/12 BUY $48.26 207 $9,989.82 $(3,425)
9/24/12 SELL $49.32 $10,201.24 $211.42 4 $14.14 $(3,411)
10/18/12 BUY $49.63 201 $9,975.63 $(3,411)
10/24/12 SELL $49.17 $9,875.17 $(100.46) $(100.46) $(3,511)
1/2/13 BUY $53.00 188 $9,963.06 $(3,511)
1/15/13 SELL $52.85 $9,927.80 $(35.26) $(35.26) $(3,547)
1/24/13 BUY $54.39 183 $9,952.46 $(3,547)
2/20/13 SELL $56.22 $10,279.35 $326.89 5 $45.82 $(3,501)
4/4/13 BUY $55.57 179 $9,946.14 $(3,501)
4/15/13 SELL $56.41 $10,089.39 $143.25 2 $30.43 $(3,470)
5/9/13 BUY $55.08 181 $9,969.48 $(3,470)
5/21/13 SELL $55.46 $10,029.36 $59.88 1 $4.42 $(3,466)
7/5/13 BUY $53.81 185 $9,954.85 $(3,466)
7/18/13 SELL $53.55 $9,898.75 $(56.10) $(56.10) $(3,522)
8/12/13 BUY $53.02 188 $9,966.82 $(3,522)
8/15/13 SELL $53.29 $10,009.58 $42.76 $42.76 $(3,479)
9/10/13 BUY $53.27 187 $9,961.49 $(3,479)
10/3/13 SELL $55.21 $10,315.34 $353.84 6 $22.61 $(3,457)
12/16/13 BUY $52.68 189 $9,955.58 $(3,457)
12/31/13 SELL $54.46 $10,284.94 $329.37 6 $2.60 $(3,454)

[/s2If]

Gold prices have dropped a bit in the last couple months. This has caused some consternation among some investors. This is utterly foolish!

My gut is investing in gold right now is not particularly logical. It unquestionably is trending down. That is unwelcome news for some of the gold mines, but it is hardly a concern for a Confident Investor. We can easily invest in other companies that are doing well and are not subject to the whims of a commodity price. If you read this site even for a short time, you should know that I don’t like a “Buy and Hold” investment strategy.

Historically, gold was used as a safeguard against risk in the financial world. It was seen as a safe harbor when there was uncertainty in other investments. This was one of the principal reasons given when gold was growing so quickly from the beginning of 2006 to mid-2011. Then as the economy stopped hurting so badly, the price leveled off in late 2011 and 2012. It is not surprising, in fact it is expected, the price would drop with a stable economy.

As we look at the Gold ETF [stckqut]GLD[/stckqut], this is exactly what we see. There is quite a bit of volume as the price increases into 2011. Then, the volume drops substantially as the price oscillates in a sideways channel. Now the volume has increased as the price drops. What this shows is that money was flowing into this investment vehicle, it was be held, and now it is flowing out. The new home for that money is not currently clear but maybe it is the reason the stock market has been breaking records lately.

NYSEARCA GLD SPDR Gold Trust ETF from Google Finance

Many will point out that the economy is not as strong as it could be. That is fine. I won’t argue that point. However, the economy has been fairly stable for at least the last 12 months with a extremely slow recovery and painfully slow reduction in unemployment. The economy is not getting worse, and by most measures it is holding its own or slightly improving.

A while back I suggested that you should not invest based on politics or economic announcements. Gold is an economic announcement. You should watch it and understand it, but trying to decipher how it is going to move Google [stckqut]GOOG[/stckqut], Apple [stckqut]AAPL[/stckqut] or Ebay [stckqut]EBAY[/stckqut] is a fool’s errand.