[s2If !current_user_can(access_s2member_level1)]This information is exclusively for the registered owners of my book, “The Confident Investor” and will not be visible to other visitors to this site (you must be logged in to this site as a book owner in order to see the following analysis).

If you have registered and cannot see the technical indicators on each stock of my Watch List below, make sure you are logged in and refresh your browser.

As an example of the success that my book teaches, in a 7 year time frame from January 3, 2006 to December 31, 2012, Decker Corporation increased 304.7% if you would have implemented a pure buy-and-hold strategy. If you would implemented the strategy that I explain in my book, The Confident Investor, you would have seen a 371.2% return on your investment. This is a 21.8% increase on the profit percentage.

Can your investment system beat the market by that much?

BL-TCI-cover

You can purchase my book wherever books are sold such as AmazonBarnes and Noble, and Books A Million. It is available in paperback as well as e-book formats for NookKindle, and iPad

[/s2If]

[s2If current_user_can(access_s2member_level1)]Thank you for being a registered book owner. Please remember that the below indicators should NOT be considered signals for you to invest in or sell any of these stocks. Rather, you should double check all analysis and understand that the decision to invest in or sell one of these stocks is purely your own. This information is purely provided for educational purposes.

Read More →

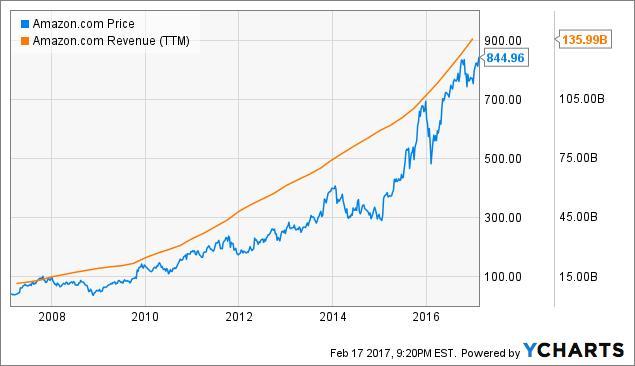
Many value investors have been sitting on the sidelines watching Amazon’s [stckqut]AMZN[/stckqut] stock continue to rise. They remain on the sidelines because they perceive Amazon as significantly overvalued in terms of P/E ratio, which factors in earnings. These value investors perceive Amazon’s stock as irrationally inflated. However, the reality is that Amazon has been expanding significantly over the years, sacrificing profits for a wide-scale distribution network. This has kept earnings suppressed, thus inflating the P/E ratio which the value investors cite as the evidence for overvaluation. While these value investors may see Amazon investors as drunk at the punchbowl, I think they are actually quite sober.

Amazon’s stock price increased at a rate that exceeded the rate of revenue growth over the past 10 years. While revenue increased about 819% over the past 10 years based on 2007 revenue of $14.8 billion and 2016 revenue of $136 billion, the stock increased by over 2,000% from $38 to $845.

I’m not expecting the pace of the stock growth to exceed the pace of revenue growth going forward. The reason for this is due to Amazon’s expanded P/E multiple. Amazon’s trailing 12-month P/E multiple was below 100 at about 86 in 2007. The current trailing P/E multiple is 172. With a much higher P/E multiple, I expect Amazon’s stock to grow below the pace of revenue growth, but still at an above average rate.

Source: Are Amazon Investors Drunk At The Punchbowl? – Amazon.com, Inc. (NASDAQ:AMZN) | Seeking Alpha

Domino’s Pizza, Inc. [stckqut]DPZ[/stckqut] is trading up 71.29% versus 12-month low of 109.71 and stands -0.01% lower from its 1-year peak of $187.94. The consensus price target (PT) of $175.37 means that the market expects Company shares to increase by -5.8% in the short run. The sell-side target prices range from $150 to $221. In the last month the stock has moved in price 13.18%, with a one year change of 68.30%. The last trading session volume compares with the 565.94K average and market worth floats around 9.03B.

Domino’s Pizza, Inc. (NYSE:DPZ) gained 0.98% to reach at the trading price of $187.93 as it is set to release its next quarterly earnings report on February 28, 2017. Domino’s Pizza, Inc. stock trades in the range of $184.76 to $187.99 before the earnings release. Let’s take a closer look at the current earnings forecast, particularly the things traders should pay close attention to. Earnings per share for the recently concluded quarter is expected to come in at $1.44 a share with $781.4M in revenue.

Domino’s Pizza, Inc. (DPZ) Future Earnings & History

After upcoming fiscal quarter results, all eyes will be on the prospects for the next reporting quarter. Analysts, on average, forecast Domino’s Pizza, Inc. to earn $1.14 per share (EPS) on revenue of $607.12M. The EPS consensus range is $1.1-$1.18 on revenue between $619.1M and $599.35M.

While if we look at the Earnings Track Record, Domino’s Pizza, Inc. (DPZ) managed to surpass quarterly earnings per share estimates in 9 of the trailing twelve fiscal quarters, and has a positive trend with an average surprise of 75%. Last time the company reported, Domino’s Pizza, Inc. (DPZ) generated $0.96 in earnings per share, beating the consensus estimate of $0.90. Revenues hit $566.68M in the September 2017 quarter, which was above the consensus $542.58M projection. On the other hand, in the June 2017 quarter the company recorded a net $547.34M revenue with earnings per share of $0.98. Wall Street had anticipated $534.09M and $0.94, respectively. For comparison, there was a revenue of $539.17M and EPS of $0.89 in the March 2016 period.

Domino’s Pizza, Inc. (NYSE:DPZ) Analyst Insights

The buoyancy in the outlook of Domino’s Pizza, Inc. (DPZ) is getting weaker by the somewhat negative sentiment (2.50 on a 5-point scale) that sell-side analysts have provided concerning it. Brokerage firms on the average advocate the company shares as Hold. BofA/Merrill has been covering shares of DPZ, so it is most recent view is worth a look. In a research note issued on Jan 20, 2017, analysts at KeyBanc Capital Mkts lifted the stock to Overweight from Sector Weight. Another noteworthy analyst activity was recorded on Oct 14, 2016. BofA/Merrill Analysts lifted the stock to Buy from Underperform.


Source: Which way Domino’s Pizza, Inc. (NYSE:DPZ) earning numbers may go

One of the biggest challenges in investing in the stock market is picking the best stocks. In my book, “The Confident Investor” I teach my readers how to pick Good Companies. This page is designed to show the raw performance of these companies. It is not designed to show my personal portfolio, which may or may not exceed the performance stated here. Since I use the trading system described in my book, you can assume that I beat the performance recorded here.

I have created three tables below. The first table is the general market – NASDAQ and S&P500. Every investor should try to beat the average of these two indexes. In this report, my larger Watch List beats this metric easily.

I must caution you, I do not actually propose that you “buy and hold” any given stock, but rather you should “buy to hold” the stock. My investing technique teaches you to efficiently move your money to the stocks that are currently increasing in value the most. I use my Watch List for this work, these are Good Companies that I wait for great buying opportunities. This strategy is well described in my book, “The Confident Investor” and tends to be a very safe strategy in bear markets while typically still providing above market returns in a bull or flat market.

My Short Term Watch List are 15 companies that are hot right now. I select this list every quarter. I evenly divide a portion of my portfolio among these 15 companies. The next quarter, I add or delete companies as necessary and then re-balance the portfolio. This tends to be a more risky strategy because I don’t bail out on bad stock movement (at least until the end of the quarter). In a bull market or a flat market, these very well-run and high-performing companies tend to beat the general market by a significant margin.

BL-TCI-cover

You can purchase my book wherever books are sold such as Amazon, Barnes and Noble, and Books A Million. It is available in paperback as well as e-book formats for Nook, Kindle, and iPad.

Stock Indexes Performance

1 week ago 1 month ago 1 quarter ago 1 year ago
Index Close Profit % Close Profit % Close Profit % Close Profit
^GSPC $2,316.10 1.51% $2,263.69 3.86% $2,181.90 7.76% $1,917.78 22.60%
^IXIC $5,734.13 1.82% $5,540.08 5.39% $5,321.51 9.72% $4,504.43 29.62%

Week average for Indexes: 1.67%
Month average for Indexes: 4.63%
Quarter average for Indexes: 8.74%
Year average for Indexes: 26.11%

Watch List Performance

1 week ago 1 month ago 1 quarter ago 1 year ago
Stock Close Profit % Close Profit % Close Profit % Close Profit
AAPL $132.12 2.72% $119.26 13.80% $109.58 23.85% $94.05 44.30%
ABMD $108.64 7.30% $112.21 3.89% $113.41 2.79% $81.32 43.35%
ALGN $96.97 4.95% $90.55 12.39% $94.84 7.31% $63.29 60.80%
ALXN $126.51 1.83% $134.35 -4.12% $119.85 7.48% $145.89 -11.70%
AMAT $35.22 1.28% $33.65 5.99% $30.55 16.74% $18.03 97.84%
AMZN $827.46 2.13% $809.04 4.45% $760.16 11.17% $534.90 57.99%
AYI $212.16 3.83% $206.45 6.70% $248.80 -11.46% $190.65 15.55%
AZPN $55.97 1.95% $55.16 3.44% $52.07 9.58% $33.79 68.87%
BABA $102.36 -1.80% $96.17 4.52% $93.39 7.63% $67.28 49.41%
BWLD $159.55 -0.31% $146.15 8.83% $166.40 -4.42% $150.43 5.73%
CBPO $114.06 -3.44% $106.89 3.04% $116.32 -5.31% $116.67 -5.60%
COF $88.40 3.86% $86.32 6.36% $81.64 12.46% $64.31 42.76%
CRUS $54.19 2.10% $55.60 -0.49% $57.79 -4.26% $33.17 66.81%
CVCO $111.20 2.97% $94.15 21.61% $91.25 25.48% $79.00 44.94%
DPZ $186.37 0.84% $166.04 13.18% $163.92 14.64% $111.66 68.30%
EW $90.34 -0.66% $96.29 -6.80% $89.03 0.80% $86.21 4.09%
EXR $75.00 3.00% $73.10 5.68% $69.86 10.58% $83.11 -7.06%
FB $134.19 -0.49% $127.55 4.69% $117.02 14.11% $104.57 27.69%
GOOGL $834.85 1.40% $824.37 2.69% $775.97 9.10% $722.11 17.23%
GTN $12.60 -0.40% $10.55 18.96% $9.55 31.41% $10.78 16.42%
GWR $74.19 1.62% $74.53 1.15% $76.72 -1.73% $56.59 33.22%
HDSN $7.65 1.05% $7.43 4.04% $7.61 1.58% $3.16 144.62%
HOG $56.98 -0.08% $57.86 -1.61% $57.44 -0.89% $40.89 39.23%
HSKA $83.97 -1.08% $78.16 6.27% $68.36 21.50% $31.57 163.10%
HZO $21.55 5.34% $18.20 24.73% $18.10 25.41% $16.38 38.58%
LNCE $39.19 -0.48% $38.02 2.58% $37.45 4.14% $30.26 28.88%
LULU $67.62 -1.32% $66.99 -0.39% $54.61 22.19% $60.76 9.83%
MCK $139.57 7.65% $147.29 2.01% $139.78 7.49% $153.22 -1.94%
MEI $41.80 0.96% $40.75 3.56% $36.67 15.08% $26.79 57.55%
MET $52.91 0.11% $53.62 -1.22% $54.41 -2.64% $37.79 40.18%
MIDD $137.13 0.79% $134.66 2.64% $130.21 6.14% $87.25 58.41%
MNST $44.01 -0.86% $43.35 0.65% $41.68 4.68% $42.53 2.59%
MRK $64.15 1.93% $60.33 8.39% $61.40 6.50% $48.55 34.68%
NFLX $144.82 -1.80% $138.41 2.75% $115.21 23.44% $89.23 59.39%
NVDA $113.62 -5.62% $105.16 1.97% $93.22 15.03% $30.15 255.65%
PCLN $1,646.51 -0.55% $1,539.02 6.39% $1,507.35 8.63% $1,283.74 27.55%
REGN $359.87 3.14% $363.41 2.14% $397.48 -6.62% $394.98 -6.03%
SAM $162.50 4.46% $153.20 10.80% $165.80 2.38% $181.02 -6.23%
SBUX $56.22 2.01% $57.63 -0.49% $55.52 3.30% $56.75 1.06%
STZ $155.45 3.78% $149.19 8.13% $154.75 4.25% $138.10 16.81%
SUI $80.27 0.82% $77.53 4.39% $70.43 14.90% $64.49 25.49%
SWKS $92.21 4.49% $78.22 23.17% $77.97 23.57% $62.09 55.18%
THRM $35.50 0.56% $34.05 4.85% $30.85 15.72% $41.15 -13.24%
TMO $154.89 2.42% $144.32 9.92% $145.66 8.91% $129.62 22.39%
TRN $28.10 2.63% $28.45 1.37% $25.88 11.44% $16.11 79.01%
UA $19.04 3.73% $25.26 -21.81% $23.75 -16.84% $0.00 0.00%
ULTA $269.84 1.97% $266.12 3.39% $250.09 10.02% $150.07 83.35%

Week average for Watch List stocks: 1.50% compared to indexes for same period at: 1.67%
Month average for Watch List stocks: 5.08% compared to indexes for same period at: 4.63%
Quarter average for Watch List stocks: 8.67% compared to indexes for same period at: 8.74%
Year average for Watch List stocks: 41.64% compared to indexes for same period at: 26.11%

Short Term Watch List

1 week ago 1 month ago 1 quarter ago 1 year ago
Stock Close Profit % Close Profit % Close Profit % Close Profit
ABMD $108.64 7.30% $112.21 3.89% $113.41 2.79% $81.32 43.35%
ALGN $96.97 4.95% $90.55 12.39% $94.84 7.31% $63.29 60.80%
AMAT $35.22 1.28% $33.65 5.99% $30.55 16.74% $18.03 97.84%
AMZN $827.46 2.13% $809.04 4.45% $760.16 11.17% $534.90 57.99%
AYI $212.16 3.83% $206.45 6.70% $248.80 -11.46% $190.65 15.55%
CBPO $114.06 -3.44% $106.89 3.04% $116.32 -5.31% $116.67 -5.60%
CRUS $54.19 2.10% $55.60 -0.49% $57.79 -4.26% $33.17 66.81%
DPZ $186.37 0.84% $166.04 13.18% $163.92 14.64% $111.66 68.30%
EW $90.34 -0.66% $96.29 -6.80% $89.03 0.80% $86.21 4.09%
HDSN $7.65 1.05% $7.43 4.04% $7.61 1.58% $3.16 144.62%
HSKA $83.97 -1.08% $78.16 6.27% $68.36 21.50% $31.57 163.10%
NVDA $113.62 -5.62% $105.16 1.97% $93.22 15.03% $30.15 255.65%
STZ $155.45 3.78% $149.19 8.13% $154.75 4.25% $138.10 16.81%
SUI $80.27 0.82% $77.53 4.39% $70.43 14.90% $64.49 25.49%
ULTA $269.84 1.97% $266.12 3.39% $250.09 10.02% $150.07 83.35%

Week average for Short Term Watch List stocks: 1.28% compared to indexes for same period at: 1.67%
Month average for Short Term Watch List stocks: 4.70% compared to indexes for same period at: 4.63%
Quarter average for Short Term Watch List stocks: 6.65% compared to indexes for same period at: 8.74%
Year average for Short Term Watch List stocks: 73.21% compared to indexes for same period at: 26.11%

Total Execution Time: 53.720441102982 Sec

This information was calculated on Feb 19, 2017 and is based on the closing value of the most recent trading day which may not be today.
This information is based on the Yahoo Historical Pricing and is only as good or as current as that data.
My Short Term Watch List (including $ABMD) grew by 73.21% over the last year

My Watch List (including $ULTA) grew by 41.64% over the last year

My Short Term Watch List (including $SUI) grew by 73.21% over the last year

Applied Materials, Inc. [stckqut]AMAT[/stckqut] is a large market cap stock with a market cap of 38639.17. It is in the Semiconductor Equipment & Materials industry and sector Technology, with a current P/E of 22.97, a forward P/E of 13.65 and EPS of 1.55. At a stock price of 35.67 (1.39%) it has a dividend yield of 1.12%.

EPS growth for the last five years have been 1.30%, more recently this last year it has grown by 37.30%. The next year growth is going to be about 7.05% and more long-term 15.63% after five years. EPS growth quarter over quarter is 97.30%. Sales growth for the past five years have been 0.60% and sales growth quarter over quarter is 39.20%.

For performance, Applied Materials, Inc. the past week has seen a gain of 0.99%. For the last month performance for Applied Materials, Inc. is 5.69%. While the last quarter is 19.20% and half year, 29.72%. Finally for the year, performance is 97.28%.

The 52-week high for Applied Materials, Inc., is at -0.50%, and for the 52-week low it comes to a value of 116.09%. The 20-day simple moving average is 6.26% and 25.08% for the 200-day simple moving average.

Source: How has Applied Materials, Inc.:(NASDAQ:AMAT) performed recently?