Is the corporate buyback falling out of favor?
The corporate buyback binge continues at full tilt. But, perhaps with good reason, investors may be losing faith in its ability to propel share prices.
U.S. companies authorized $158 billion of new stock buyback programs in January and February, according to Birinyi Associates Inc. While there is no guarantee the rest of 2016 will maintain such a pace, it marked the best start to a year since the research firm started tracking this data in 1984.
I am not a big lover of companies that buyback their stock from the market. In general, I prefer a company that has so many great ideas for new products and new services that they want to invest in their future potential.
Companies have limited cash. The management of the company along with the Board of Directors has to decide the best use for that cash. Do they save it for a rainy day, do they invest in new products, or do they return that money to their shareholders. It should all be summed up with a simply question: What will make the company more valuable?
I feel that a signal of a company that has stagnated is a company that cannot figure out how to grow the company with new products and services. While the short-term goal of moving the stock up in value with a buyback is nice, it simply means the company is at risk of being a great provider in the next couple of years.
There are situations where a buyback is worthwhile. Most notably, this occurs in companies that have large R&D budgets. Especially, if those budgets are larger than their direct competitors. In that case, the company is investing in its future and increasing the short-term stock price.
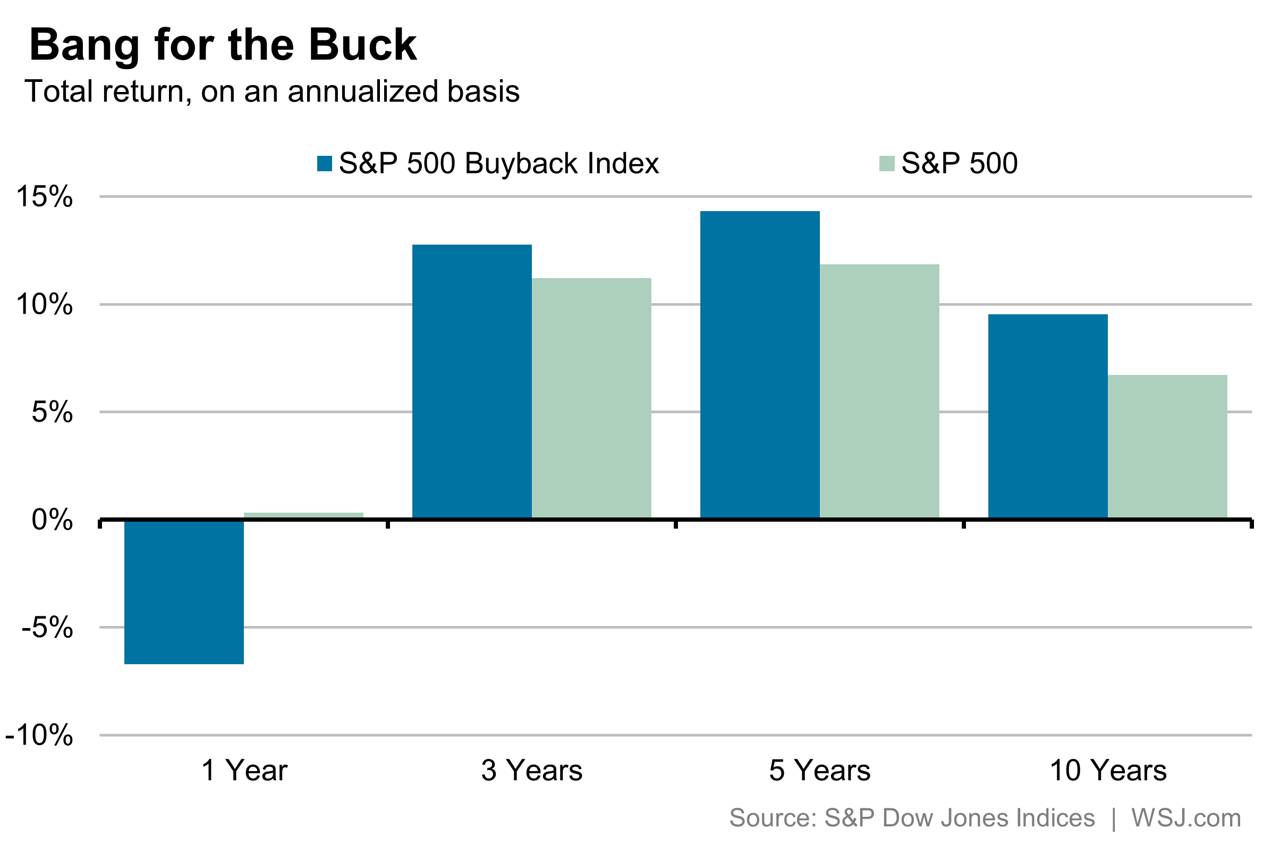
So, one explanation for the sputtering Buyback Index is that investors smell trouble. Another explanation is more benign: That there are more investors like me that are optimistic about the economy and are rewarding companies that plow money into productive assets.
Comparing mutual fund rating systems from Lipper and Morningstar

 A balanced portfolio should include great companies and mutual fund stock indexes. In order to effectively buy a mutual fund, you should evaluate its performance using one of the mutual fund rating systems. Both the Morningstar and Lipper mutual fund rating systems provide comparative ranking of fund performance ranging from 1 year to 10 years. The primary difference lies in the metrics used to determine which funds rank highest to lowest in a category (i.e. peer group).
Morningstar mutual fund rating system overview
The Morningstar system relies on a single metric: a calculation of risk-adjusted return. The risk adjustment incorporates a utility function to reflect how investors’ trade-off return and risk for factors such as loss aversion. Also, Morningstar will adjust for taxes in its risk-adjusted return calculation if most investors in that fund qualify for the same tax treatment. The resulting risk-adjusted returns are segmented into five categories (1 to 5 stars) based on a bell-shaped (i.e. normal) distribution.
Lipper mutual fund rating system overview
The Lipper system evaluates fund performance using metrics which determine the overall ranking for a fund. These five metrics are
- Total return (not risk-adjusted)
- Consistency of Return
- Preservation of Capital
- Fund Expense
- Tax Efficiency
One advantage of the Lipper system is that investors can dig into an overall Lipper ranking to determine which of these five metrics played a crucial role. Funds within the same peer group are ranked into one of five categories numbered 1 to 5 (best to worst) using a flat distribution of 20% each so that an equal number of funds are assigned to each performance category. Lipper also provides an overall fund rating based on total return with capital gains and dividends re-invested.
Morningstar Mutual Fund Rating System Methodology
Morningstar Ratings has the following characteristics:
- Mutual funds are evaluated against a peer group
- Ratings are based on the funds’ risk-adjusted returns
Within each Morningstar Category, the top 10% of funds receive five stars, and the bottom 10% receives one star. The 4-star category encompasses 22.5% of the peer group as does the 2-star category (immediately above the 1-star category). The middle category (3 stars) contains the remaining 35% of funds.
Funds are rated for up to three time-periods:three-, five-, and 10-years. These multi-year ratings are combined to produce an overall score.
Ratings are objective, based entirely on a mathematical evaluation of risk-adjusted past performance. They’re a useful tool for identifying funds worthy of further research, but shouldn’t be considered buy or sell signals.
Lipper Mutual Fund Rating System Methodology
Lipper ranks mutual funds according to a peer-based performance system which measures returns according to specific time frames and fund classifications (small, mid, multi and large-cap). Mutual fund returns are assigned a rank that places each fund within a group – the lower the number rank, the better the fund performed compared to other funds in the classification group. For example, a rank of 24 indicates that the fund has the 24th best rate of return in its category. In effect, Lipper ranking reflects how well the fund performed compared to its peers for a given period. Because the number of mutual funds in a classification group can vary widely, Lipper also calculates a percentile measure for each fund.
Lipper ratings are derived from formulas that analyze funds against clearly defined criteria. Funds are ranked against their peers on each of five measures:
- Total Return
- Consistent Return
- Preservation
- Expense
- Tax Efficiency
Each of these criteria is defined below:
Scores are subject to change every month and are calculated for the following periods: 3-year, 5-year, 10-year, and overall. The overall calculation is based on an equal-weighted average of percentile ranks for each measure over 3-year, 5-year, and 10-year periods (if applicable). For each measure, the highest 20% of funds in each peer group are named Lipper Leaders. The next 20% receive a rating of 2; the middle 20% are rated 3; the next 20% are rated 4, and the lowest 20% are rated 5.
- Total Return – A Lipper Leader for Total Return is a fund that has provided superior total returns when compared to a group of similar funds.
- Consistent Return – A Lipper Leader for Consistent Return is a fund that has provided superior consistency and risk-adjusted returns when compared to a group of similar funds.
- Preservation – A Lipper Leader for Preservation is a fund that has demonstrated a superior ability to preserve capital in a variety of markets when compared with its peers.
- Expense – Lipper Leaders for Expense are funds that have successfully managed to keep its expenses low relative to its peers and within its load structure.
- Tax Efficiency – A Lipper Leader for Tax Efficiency is a fund that has been successful at postponing taxes over the measurement period relative to similar funds.
