[s2If !current_user_can(access_s2member_level1)]This information is exclusively for the registered owners of my book, “The Confident Investor” and will not be visible to other visitors to this site (you must be logged in to this site as a book owner in order to see the following analysis).

If you have registered and cannot see the technical indicators on each stock of my Watch List below, make sure you are logged in and refresh your browser.

As an example of the success that my book teaches, in a 7 year time frame from January 3, 2006 to December 31, 2012, Decker Corporation increased 304.7% if you would have implemented a pure buy-and-hold strategy. If you would implemented the strategy that I explain in my book, The Confident Investor, you would have seen a 371.2% return on your investment. This is a 21.8% increase on the profit percentage.

Can your investment system beat the market by that much?

BL-TCI-cover

You can purchase my book wherever books are sold such as AmazonBarnes and Noble, and Books A Million. It is available in paperback as well as e-book formats for NookKindle, and iPad

[/s2If]

[s2If current_user_can(access_s2member_level1)]Thank you for being a registered book owner. Please remember that the below indicators should NOT be considered signals for you to invest in or sell any of these stocks. Rather, you should double check all analysis and understand that the decision to invest in or sell one of these stocks is purely your own. This information is purely provided for educational purposes.

Read More →


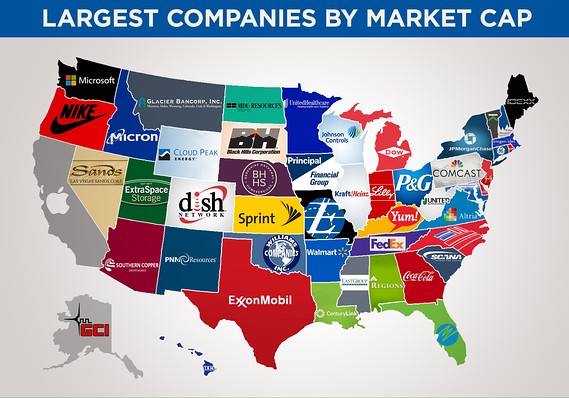
A map of the largest company in each state by market cap from Broadview Networks looks much like the 2015 edition. Apple Inc. is still the big cheese in California and ExxonMobil is king in Texas while J.P. Morgan Chase & Co. reigns supreme in New York.

Source: This map shows the biggest company in each state by market cap – MarketWatch

[s2If !current_user_can(access_s2member_level1)]This information is exclusively for the registered owners of my book, “The Confident Investor” and will not be visible to other visitors to this site (you must be logged in to this site as a book owner in order to see the following analysis).

If you have registered and cannot see the technical indicators on each stock of my Watch List below, make sure you are logged in and refresh your browser.

As an example of the success that my book teaches, in a 7 year time frame from January 3, 2006 to December 31, 2012, Decker Corporation increased 304.7% if you would have implemented a pure buy-and-hold strategy. If you would implemented the strategy that I explain in my book, The Confident Investor, you would have seen a 371.2% return on your investment. This is a 21.8% increase on the profit percentage.

Can your investment system beat the market by that much?

BL-TCI-cover

You can purchase my book wherever books are sold such as AmazonBarnes and Noble, and Books A Million. It is available in paperback as well as e-book formats for NookKindle, and iPad

[/s2If]

[s2If current_user_can(access_s2member_level1)]Thank you for being a registered book owner. Please remember that the below indicators should NOT be considered signals for you to invest in or sell any of these stocks. Rather, you should double check all analysis and understand that the decision to invest in or sell one of these stocks is purely your own. This information is purely provided for educational purposes.

Read More →

Symbol Stock Price change today
REGN Regeneron Pharmaceuticals Inc. 2.86%
MCK McKesson Corporation Common Sto 1.97%
NFLX Netflix Inc. 1.44%
PCLN The Priceline Group Inc. 1.08%
UA Under Armour Inc. Class C Comm 0.77%
SBUX Starbucks Corporation 0.74%
NVDA NVIDIA Corporation 0.73%
CRUS Cirrus Logic Inc. 0.72%
LULU lululemon athletica inc. 0.66%
LNCE Snyder’s-Lance Inc. 0.60%
DPZ Domino’s Pizza Inc Common Stock 0.55%
GWR Genesee & Wyoming Inc. Class A 0.48%
GOOGL Alphabet Inc. 0.40%
TMO Thermo Fisher Scientific Inc Co 0.36%
ABMD ABIOMED Inc. 0.30%
EW Edwards Lifesciences Corporatio 0.29%
THRM Gentherm Inc 0.27%
HZO MarineMax Inc. (FL) Common St 0.23%
AAPL Apple Inc. 0.17%
AZPN Aspen Technology Inc. 0.14%
AMZN Amazon.com Inc. 0.14%
ALGN Align Technology Inc. 0.13%
SAM Boston Beer Company Inc. (The) 0.07%
BABA Alibaba Group Holding Limited A 0.04%
MRK Merck & Company Inc. Common St 0.02%
GTN Gray Communications Systems In 0.00%
FB Facebook Inc. -0.01%
HOG Harley-Davidson Inc. Common St -0.03%
MIDD The Middleby Corporation -0.03%
CBPO China Biologic Products Inc. -0.08%
MNST Monster Beverage Corporation -0.09%
SWKS Skyworks Solutions Inc. -0.11%
CVCO Cavco Industries Inc. -0.17%
STZ Constellation Brands Inc. Comm -0.23%
AMAT Applied Materials Inc. -0.28%
ALXN Alexion Pharmaceuticals Inc. -0.36%
ULTA Ulta Beauty Inc. -0.49%
HSKA Heska Corporation -0.51%
MEI Methode Electronics Inc. Commo -0.56%
MET MetLife Inc. Common Stock -0.62%
AYI Acuity Brands Inc (Holding Comp -0.71%
EXR Extra Space Storage Inc Common -0.77%
SUI Sun Communities Inc. Common St -0.91%
TRN Trinity Industries Inc. Common -1.12%
HDSN Hudson Technologies Inc. -1.82%
COF Capital One Financial Corporati -1.99%
BWLD Buffalo Wild Wings Inc. -2.02%

Institutional investors currently hold around $260 billion or 64.2% in Amazon [stckqut]AMZN[/stckqut] stock.

Look at its top three institutional owners. Vanguard Group Inc owns $21.44 billion in Amazon.com, Inc., which represents roughly 5.26% of the company’s market cap and approximately 8.25% of the institutional ownership. Similar statistics are true for the second largest owner, Price T Rowe Associates Inc, which owns 20,919,431 shares of the stock are valued at $17.84 billion. The third largest holder is Fmr Llc, which currently holds $16.49 billion worth of this stock and that ownership represents nearly 4.05% of its market capitalization.

At the end of 12/31/2016 reporting period, 984 institutional holders increased their position in Amazon.com by some 14,465,876 shares, 724 decreased positions by 23,425,019 and 164 held positions by 266,929,329. That puts total institutional holdings at 304,820,224 shares, according to SEC filings. The stock grabbed 219 new institutional investments totaling 3,835,622 shares while 136 institutional investors sold out their entire positions totaling 3,989,532 shares.

Multiple company employees have indulged in significant insider trading. Amazon.com, Inc. disclosed in a document filed with the US Securities and Exchange Commission (SEC) that Director RYDER THOMAS O has sold 4,000 shares of Amazon.com, Inc. in trading session dated Mar. 01, 2017. These shares are worth $3,408,880 and were traded at $852.22 each. The SEC filing shows that ALBERG TOM A performed a sale of 590 shares. The Director disposed these shares by way of transaction on Feb. 21, 2017. The company’s shares were given away at $850 per share worth to an income of some $501,500 on account of ALBERG TOM A.Senior Vice President, Zapolsky David, sold 503 common shares of Amazon.com, Inc. in the open market. In a transaction dated Feb. 21, 2017, the shares were put up for sale at an average price of $850, raking in a sum of $427,550. After this sale, 2,523 common shares of AMZN are directly owned by the insider, with total stake valued at $2,153,179.In the transaction dated Feb. 15, 2017, the great number of shares disposed came courtesy the CEO Worldwide Consumer; WILKE JEFFREY A disposed a total of 4,890 shares at an average price of $840.06, amounting to approximately $4,107,893. The insider now directly owns 70,653 shares worth $60,296,683.

Source: Amazon.com, Inc. (NASDAQ:AMZN): A Detailed Look at its Institutional Ownership | Post Analyst