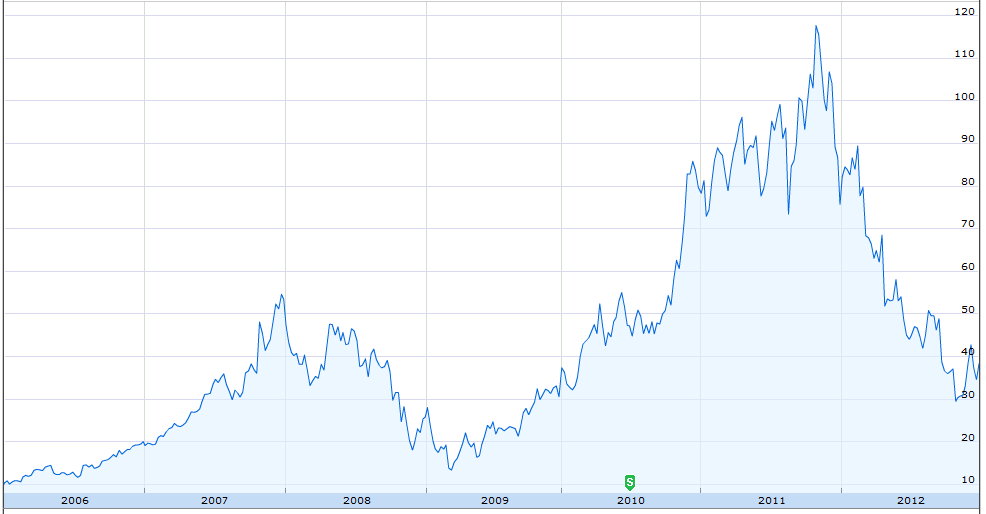
Company name Five Star Quality Care, Inc.
Stock ticker FVE
Live stock price [stckqut]FVE[/stckqut]
P/E compared to competitors Good

MANAGEMENT EXECUTION

Employee productivity Poor
Sales growth Fair
EPS growth Good
P/E growth Good
EBIT growth Good

ANALYSIS

Confident Investor Rating Good
Target stock price (TWCA growth scenario) $9
Target stock price (averages with growth) $5.61
Target stock price (averages with no growth) $1.56
Target stock price (manual assumptions) $7.34

The following company description is from Google Finance: http://www.google.com/finance?q=fve

Five Star Quality Care, Inc. (Five Star), operates senior living communities, including independent living communities, assisted living communities and skilled nursing facilities (SNFs). As of December 31, 2011, the Company operated 245 senior living communities located in 30 states containing 27,159 living units, including 207 primarily independent and assisted living communities with 23,736 living units and 38 SNFs with 3,423 living units. During the year ended December 31, 2011, the Company discontinued its operations on two SNFs owned and operated by it containing 271 living units and one assisted living community leased from Senior Housing Properties Trust (SNH) and operated by it containing 103 living units. In 2011, the Company acquired from unrelated parties seven assisted living communities containing 854 living units with one located in Arizona and the other six located in Indiana, or the Indiana Communities. In September 2012, it sold its pharmacy business to Omnicare, Inc.


Confident Investor comments: At this time, I think that a Confident Investor can cautiously invest in this stock as long as the price is correct. Most of the fundamentals of this company are good, in fact the company ranks as a Good company, but there are some concerns with the price of the stock most notably it’s top line revenue growth. Even though this stock ranks as Good, I will not be adding it to my Watch List because of some of my concerns.

If you would like to understand how to evaluate companies like I do on this site, please read my book, The Confident Investor.

I have thousands of followers on Twitter. I value my conversations that I have with them. Many of my followers are fairly sophisticated investors but many followers are just getting started. I am open to anyone asking me questions on Twitter or here on this site and I will do my best to answer in a timely manner. Many of the questions that I am asked are fairly basic as the person is simply trying to get an understanding of how the market works.

This article is quite basic. If you are new to the stock market, it should offer some value to you.  If you are a more experienced investor you may want to simply pass it on to your less experienced friends.

In order to invest in the stock market, you should understand some basic concepts. The most fundamental of these is that someone must own any company. I will not get into the ethical or political discussion of whether the government or the private sector should own a company. For the purposes of this discussion, I assume that individuals are empowered to own the company.

Buying a company is similar to buying a lawnmower. If you would like to own a lawnmower for your yard, you would go to the stores in your community, evaluate the different mowers offered for sale, decide which features you need, and then buy the mower that best fits your needs and your budget. If you find two lawnmowers that were exactly the same, you would probably not pay double for one than you would for the other. You would purchase the lower-priced lawnmower, provided there was no difference in features and quality.

Similarly, if you decided to buy a company and you had an unlimited amount of money at your disposal, you would look at all of the companies on the market, figure out what features you wanted in the company, and then buy the most reasonably-priced company that had all of these features that you wanted.

When you buy a lawnmower, you go to a local store. To buy a company, you go to the stock market. If you look at the financial page of your newspaper, you will see rows and rows of listings for the stock prices of companies. These are all the companies that are for sale! The financial page is simply the “catalog” for companies that are for sale. When a company lists itself on the New York Stock Exchange (NYSE) or the National Association of Securities Dealers Automated Quotation System (NASDAQ), it is simply saying that it is for sale.

The problem is that you probably cannot afford to buy an entire company. IBM, for example, is one of the most respected companies on the planet (although it is currently NOT on my Watch List) and currently on sale for well over 200 billion dollars! Even the richest person in the world today cannot write a check for that much money. So how do you own a company when you do not have nearly enough money to buy it all?

Each company is broken up into smaller pieces called shares. That name is essential to understand their purpose: you are going to share ownership of this company with others. These other owners, like yourself, are called shareholders.

Let’s use an example that may be close to your everyday situation. Let’s imagine that within easy driving distance from your home is a professional sports team named the Capitalists. You are a big fan of the Capitalists and think that their games are a lot of fun. You want to buy four season tickets to the games, for you, your spouse, and your kids. You discover that each season ticket is $1,000, which means that you would need to spend $4,000 for your family. You cannot afford $4,000, and were hoping to pay $1,000.

You could break the news to your family that they all cannot go together to the game and only buy the one seat that you can afford. This means that you go to one game out of four, your spouse to another one in four, and so on. This is not as much fun for everyone, so you decide not to buy the tickets.

You overhear a couple of your friends from work talking about the Capitalists. They wish they could see more games since they are so much fun to attend. You reach out to three of them and offer that each of you put up $1,000 each and share the four tickets. This way each family gets to see one game out of four.

Buying stock in a company is almost exactly the same as sharing the cost of sports seats. The difference is that you do not personally divide up the shares. Neither do you find the friends to go in with you on the purchase. That part is done for you when the company listed itself for sale on the stock exchange. All you have to do is figure out which company you want to buy and then you go to the store (NYSE or NASDAQ) and buy the number of shares (or percentage of the company) that you can personally afford.

You can learn more about the stock market and, more importantly, how to make money in the stock market by buying my book. You can purchase my book wherever books are sold such as AmazonBarnes and Noble, and Books A Million. It is available in ebook formats for NookKindle, and iPad.

Company name Yum! Brands, Inc.
Stock ticker YUM
Live stock price [stckqut]YUM[/stckqut]
P/E compared to competitors Good

MANAGEMENT EXECUTION

Employee productivity Good
Sales growth Fair
EPS growth Good
P/E growth Poor
EBIT growth Good

ANALYSIS

Confident Investor Rating Good
Target stock price (TWCA growth scenario) $63.65
Target stock price (averages with growth) $76.67
Target stock price (averages with no growth) $63.62
Target stock price (manual assumptions) $71.15

The following company description is from Google Finance: http://www.google.com/finance?q=yum

Yum! Brands, Inc. (YUM) is a quick service restaurant company based on number of system units, with approximately 37,000 units in more than 120 countries and territories. The Company through its three concepts of KFC, Pizza Hut and Taco Bell (the Concepts), develops, operates, franchises and licenses a worldwide system of restaurants, which prepare, package and sell a menu of priced food items. Units are operated by a Concept or by independent franchisees or licensees under the terms of franchise or license agreements. In addition, YUM owns non-controlling interests in Chinese entities who operate in a manner similar to KFC franchisees, as well as a non-controlling interest in Little Sheep Group Limited (Little Sheep). It operates in five segments: YUM Restaurants China, YUM Restaurants International, Taco Bell U.S., KFC U.S. and Pizza Hut U.S. In December 2011, it sold the Long John Silver’s and A&W All-American Food Restaurants brands. On February 1, 2012, it acquired Little Sheep.


Confident Investor comments: At this price and at this time, I think that a Confident Investor can confidently invest in this stock.

If you would like to understand how to evaluate companies like I do on this site, please read my book, The Confident Investor.

In a 7 year time frame from January 3, 2006 to December 31, 2012, Decker Corporation [stckqut]DECK[/stckqut] increased 304.7% if you would have implemented a pure buy-and-hold strategy. If you would implemented the strategy that I explain in my book, The Confident Investor, you would have seen a 371.2% return on your investment. This is a 21.8% increase on the profit percentage.

To put it into actual dollars, suppose you invested $10,000 in DECK on 1/3/2006. With the system that is explained in The Confident Investor, you would have exited the market on 12/31/2012 with $60,341.48. With my system, it is not uncommon for you to need a bit more cash available to cover the ongoing trades. Therefore, rather than $10,000, you would have needed $12,806.98 and your actual return would have been 371.2%. You would have 1,288 shares which were purchased with other people’s money and still have your original $10,000.

To be fair in our comparison, the buy-and-hold method if calculated with $12,763.85 would have ended up with $51,826.71 and a respectable 304.7%. You would have purchased 442 shares which had split 3:1 to 1326 shares but your original $12,806.98 would be tied up in the stock.

The profit on the buy-and-hold strategy in this scenario is $39,019.74.  The profit using GOPM (Grow on Other People’s Money) is $47,534.51.  That means the increased profit on DECK in this time frame was $8,514.77. This means your profit INCREASED by 21.8%!!

Understanding buy-and-hold is easy. You have a given amount of money, in this case $12,806.98. You buy 442 shares at the start of the test period. At the end of the test period, you sell the shares and the profit (or loss) is the standard that any other system must beat. In the case of DECK, the stock split 3:1 in the time period.

Understanding GOPM is a bit more complicated without reading my book, The Confident Investor. Before you even start to invest, the system teaches you to look for incredibly well-run companies and only invest in those companies. While DECK may or may not have qualified for this status in 2006, it does in 2013 so we are simply back-testing against a currently well-run company. While past performance doesn’t guarantee future performance, it is probably the best tool that we have to understand investment methodologies.

After you find a well-run company, you are going to buy $10,000 worth of shares when the technical indicators tell you that the stock has upward momentum. You are then going to sell those shares when that momentum slows down or reverses.  The profit that you make on that transaction, you will keep in the stock (in other words, you are not going to sell those shares). You are going to keep the $10,000 ready for when the stock has the correct momentum. If there is any excess profit (e.g. less than the value of a full share after keeping the $10,000) you will just stick that into your money-market account in this example. It is possible that you could invest this excess amount but we are going to simplify this example and just hold that money.

As a quick example, you invest $10,000 in a stock trading at $50 per share so you have purchased 200 shares.  Over the course of the next several days or weeks, the stock price increases to $55 which is where you decide to sell. To get your original capital of $10,000 back, you sell 182 shares resulting in $10,010 in your account and 18 shares that are essentially free since they were purchased with Other People’s Money. You now have your original capital of $10,000, 18 free shares and an additional $10.

Using this technique, you will make several trades per year and may even be trading weekly. Therefore, to make this model fair, I need to account for stockbroker fees and commissions.  In this example, I am using $8 for every sell and for every purchase. You may have a better fee from your favorite broker but $8 seems fair for a test. Frankly, if you are paying more than $10 for each transaction then you probably need to be looking at another broker!

Using this technique, by the end of the test on 12/31/2012 you would have 1,288 shares of DECK that cost you $2,806.98. Those 1,288 shares were acquired for $2.179 per share! This is significantly cheaper than today’s stock price and no matter what happens to DECK you could probably sell these shares for a profit at any time! You would still have the original $10,000 in your bank account! This is because you have purchased these share with Other People’s Money.  This is why I call my system GOPM – Grow on Other People’s Money.

The rest of this article shows each buy and sell transaction for those 7 years. It shows the date, the assumed purchase price on that day (taken from Yahoo – the purchase price is the average of the opening and closing price on that day) and the profit or loss. If you haven’t read my book, The Confident Investor, then you may not understand the timing of the trades. In fact, if you haven’t purchased the book and registered here on this site as a book owner then you won’t be able to see those individual trades. If you have registered and cannot see the trades, make sure you are logged in and refresh your browser.

Which brings me to the big set of questions. Shouldn’t you own this book? Does your investment strategy beat buy-and-hold? Do you even have an investment strategy? If your strategy beats buy-and-hold, does it beat GOPM – Growing on Other People’s Money?

You can purchase my book wherever books are sold such as Amazon, Barnes and Noble, and Books A Million. It is available in ebook formats for Nook, Kindle, and iPad. It may be available at your favorite bookstore as well but you may have to ask.

DECK 2006-12

Additional commentary not originally published with this article.
When this article was originally published, the following paragraphs were not included.

At the time that I wrote the article, I hadn’t discussed portfolio management on my site to any great detail. Recently, I discussed the concept of doubling your investment to the point that the free stock is equal to one allotment of your portfolio. Now that this concept has been explained, I need to add another metric to the Deckers analysis.

If you would have invested in Deckers as described in this article, you would have doubled your investment by March 2, 2007. By that date, you would have acquired 150 shares of DECK which were valued at about $67.45 for a total profit of $10,101.75. This means your $10,000 initial investment would have doubled.

This event would have occurred 292 trading days after you initiated trading on DECK. If you followed my advice on portfolio management, you would stop trading in DECK at this point and focus on other stocks to build up equity in them.

[s2If current_user_can(s2member_level1)]


Description of DECK trades table
While it may be obvious the meaning of the various columns, some of them definitely need a bit of explanation if you have never walked through a trading analysis with me.
Date – The date of the trade. It is important to note the long delays between trades. This will help you with your portfolio since you do not have to dedicate your average trade purchase (in this case $10,000) to just one stock but rather you can invest that money in the hottest stock at the time.
Buy/Sell – This is probably pretty obvious. On this date, did the system buy or sell DECK? The SELL will only sell from the previous transaction’s BUY.
Purch. Price – The selling or buying price of this transaction. This is taken from Yahoo’s Historical Pricing page and it is the average of the opening and closing price on that day.
Share – The number of shares that $10,000 will buy on that day.
Invest – The amount that was actually purchased. This is the number of shares (the previous column) multiplied by the Purch. Price column.
Returned – When you sell the shares from the previous BUY, the amount of money that results.
Profit/Loss – How much was profited from the previous BUY.
Free shares – If the SELL was profitable, how many shares was evenly divides into this profit.  These are free shares as they were purchased with Other People’s Money.
Excess – After the Free Shares are taken out, how much money is left over. If the transaction was not profitable, then what was the loss.
Running investment balance – A running total of the value of the investment.

DECK trades table
Date Action Purchase Price Shares Invested Returned Profit / Loss Free shares Excess Running investment balance
1/5/2006 BUY $29.83 335 $9,991.38 $0.00
1/19/2006 SELL $31.09 $10,405.48 $414.10 13 $10.00 $404.11
2/1/2006 BUY $32.62 306 $9,981.72 $424.06
2/7/2006 SELL $31.88 $9,747.28 ($234.44) ($234.44) $414.44
2/22/2006 BUY $32.38 308 $9,973.04 $420.94
3/7/2006 SELL $35.33 $10,873.64 $900.60 25 $17.35 $1,342.54
3/20/2006 BUY $36.86 271 $9,989.06 $1,400.68
4/11/2006 SELL $40.51 $10,968.86 $979.80 24 $7.68 $2,511.31
4/25/2006 BUY $42.51 235 $9,989.85 $2,635.62
5/8/2006 SELL $43.10 $10,119.33 $129.47 3 $0.19 $2,801.18
6/30/2006 BUY $38.28 261 $9,991.08 $2,488.20
7/7/2006 SELL $37.43 $9,761.23 ($229.85) ($229.85) $2,432.95
7/25/2006 BUY $38.06 262 $9,971.72 $2,473.90
8/10/2006 SELL $43.00 $11,256.69 $1,284.97 29 $38.11 $4,041.53
9/8/2006 BUY $42.67 234 $9,983.61 $4,010.51
10/17/2006 SELL $49.56 $11,587.87 $1,604.26 32 $18.50 $6,243.93
11/8/2006 BUY $52.99 188 $9,961.18 $6,676.11
11/24/2006 SELL $54.42 $10,222.02 $260.84 4 $43.18 $7,073.95
12/1/2006 BUY $56.12 178 $9,988.47 $7,294.95
1/4/2007 SELL $58.73 $10,445.05 $456.58 7 $45.50 $8,045.33
2/1/2007 BUY $58.56 170 $9,954.35 $8,022.04
2/23/2007 SELL $63.86 $10,848.20 $893.85 13 $63.67 $9,579.00
3/1/2007 BUY $66.00 151 $9,965.25 $9,899.25
3/27/2007 SELL $72.11 $10,879.86 $914.61 12 $49.35 $11,681.01
4/16/2007 BUY $72.25 138 $9,970.50 $11,704.50
4/24/2007 SELL $73.13 $10,083.25 $112.75 1 $39.63 $11,919.38
4/27/2007 BUY $73.99 135 $9,988.65 $12,060.37
7/11/2007 SELL $101.62 $13,710.03 $3,721.38 36 $63.23 $20,221.39
7/23/2007 BUY $105.68 94 $9,933.92 $21,030.32
7/24/2007 SELL $103.72 $9,741.21 ($192.71) ($192.71) $20,639.29
9/18/2007 BUY $100.87 99 $9,986.13 $20,073.13
10/11/2007 SELL $112.21 $11,100.30 $1,114.17 9 $104.32 $23,338.64
10/22/2007 BUY $112.82 88 $9,928.16 $23,466.56
11/9/2007 SELL $127.50 $11,212.00 $1,283.84 10 $8.84 $27,795.00
11/26/2007 BUY $133.21 75 $9,990.38 $29,038.69
12/31/2007 SELL $157.08 $11,773.00 $1,782.63 11 $54.75 $35,971.32
4/2/2008 BUY $112.68 88 $9,915.84 $25,803.72
4/9/2008 SELL $112.31 $9,875.28 ($40.56) ($40.56) $25,718.99
4/17/2008 BUY $117.26 85 $9,966.68 $26,851.40
4/23/2008 SELL $117.00 $9,936.58 ($30.10) ($30.10) $26,791.86
4/25/2008 BUY $138.85 71 $9,858.00 $31,795.51
5/7/2008 SELL $139.95 $9,928.10 $70.10 0 $70.10 $32,047.41
6/20/2008 BUY $137.21 72 $9,879.12 $31,421.09
7/2/2008 SELL $135.41 $9,741.52 ($137.60) ($137.60) $31,008.89
12/16/2008 BUY $65.36 152 $9,934.72 $14,967.44
1/7/2009 SELL $79.07 $12,010.64 $2,075.92 26 $20.10 $20,162.85
3/24/2009 BUY $49.73 200 $9,946.00 $12,681.15
4/15/2009 SELL $60.73 $12,137.00 $2,191.00 36 $4.90 $17,670.98
6/1/2009 BUY $60.25 165 $9,940.43 $17,531.30
7/2/2009 SELL $69.44 $11,449.60 $1,509.18 21 $50.94 $21,665.28
7/15/2009 BUY $68.89 145 $9,988.33 $21,492.12
7/24/2009 SELL $68.16 $9,874.48 ($113.85) ($113.85) $21,264.36
8/12/2009 BUY $69.37 144 $9,988.56 $21,641.88
8/17/2009 SELL $68.74 $9,890.56 ($98.00) ($98.00) $21,446.88
9/14/2009 BUY $70.91 140 $9,926.70 $22,122.36
10/1/2009 SELL $83.11 $11,626.70 $1,700.00 20 $37.90 $27,590.86
10/14/2009 BUY $87.56 114 $9,981.27 $29,068.26
10/28/2009 SELL $93.40 $10,639.03 $657.76 7 $4.00 $31,660.91
11/9/2009 BUY $95.66 104 $9,948.12 $32,427.05
11/19/2009 SELL $96.75 $10,053.48 $105.36 1 $8.61 $32,893.30
12/4/2009 BUY $97.92 102 $9,987.84 $33,292.80
12/15/2009 SELL $97.52 $9,939.04 ($48.80) ($48.80) $33,156.80
12/28/2009 BUY $98.13 101 $9,911.13 $33,364.20
1/20/2010 SELL $107.73 $10,872.23 $961.09 8 $99.29 $37,488.30
2/24/2010 BUY $101.89 98 $9,985.22 $35,457.72
4/12/2010 SELL $136.41 $13,360.18 $3,374.96 24 $101.12 $50,744.52
4/22/2010 BUY $139.83 71 $9,927.93 $52,016.76
4/30/2010 SELL $145.59 $10,328.54 $400.61 2 $109.44 $54,448.79
6/1/2010 BUY $142.70 70 $9,988.65 $53,367.93
6/22/2010 SELL $158.74 $11,103.45 $1,114.80 7 $3.66 $60,478.04
7/27/2010 BUY $50.94 196 $9,983.26 $58,218.71
8/6/2010 SELL $49.29 $9,652.84 ($330.42) ($330.42) $56,338.47
9/17/2010 BUY $47.64 209 $9,955.72 $54,446.81
9/22/2010 SELL $47.19 $9,853.67 ($102.05) ($102.05) $53,932.46
9/24/2010 BUY $47.39 210 $9,951.90 $54,166.77
10/7/2010 SELL $50.21 $10,535.05 $583.15 11 $30.89 $57,936.57
10/12/2010 BUY $51.35 194 $9,960.93 $59,252.13
10/19/2010 SELL $52.56 $10,187.67 $226.74 4 $16.52 $60,858.69
10/26/2010 BUY $54.55 183 $9,982.65 $63,168.90
12/28/2010 SELL $84.22 $15,403.35 $5,420.70 64 $30.94 $102,910.73
2/7/2011 BUY $82.82 120 $9,938.40 $101,206.04
3/1/2011 SELL $86.25 $10,342.00 $403.60 4 $58.60 $105,742.50
3/30/2011 BUY $86.53 115 $9,950.95 $106,085.78
4/12/2011 SELL $87.74 $10,081.53 $130.57 1 $42.84 $107,650.85
4/18/2011 BUY $92.28 108 $9,966.24 $113,227.56
4/29/2011 SELL $86.03 $9,282.70 ($683.54) ($683.54) $105,552.68
5/26/2011 BUY $90.18 110 $9,919.25 $110,644.73
6/1/2011 SELL $89.86 $9,876.60 ($42.65) ($42.65) $110,258.22
6/30/2011 BUY $87.82 113 $9,923.66 $107,755.14
7/27/2011 SELL $93.59 $10,567.67 $644.01 6 $82.47 $115,396.47
8/1/2011 BUY $101.26 98 $9,923.48 $124,853.58
8/4/2011 SELL $98.03 $9,598.94 ($324.54) ($324.54) $120,870.99
9/8/2011 BUY $90.67 110 $9,973.70 $111,796.11
9/22/2011 SELL $95.05 $10,447.50 $473.80 4 $93.60 $117,576.85
10/7/2011 BUY $100.48 99 $9,947.03 $124,287.58
10/18/2011 SELL $101.96 $10,086.04 $139.02 1 $37.06 $126,226.48
10/28/2011 BUY $114.22 87 $9,936.71 $141,398.17
11/9/2011 SELL $108.14 $9,399.75 ($536.96) ($536.96) $133,871.13
2/8/2012 BUY $86.43 115 $9,939.45 $107,000.34
2/10/2012 SELL $84.40 $9,698.00 ($241.45) ($241.45) $104,487.20
2/16/2012 BUY $87.53 114 $9,977.85 $108,355.95
2/24/2012 SELL $79.33 $9,035.62 ($942.23) ($942.23) $98,210.54
8/15/2012 BUY $45.48 219 $9,960.12 $56,304.24
9/4/2012 SELL $49.04 $10,731.76 $771.64 15 $36.04 $61,447.12
11/27/2012 BUY $35.69 280 $9,991.80 $44,713.31
12/10/2012 SELL $40.90 $11,442.60 $1,450.80 35 $19.47 $52,672.76
[/s2If]

Company name Chesapeake Energy Corporation
Stock ticker CHK
Live stock price [stckqut]CHK[/stckqut]
Confident Investor Rating Poor

The following company description is from Google Finance: http://www.google.com/finance?q=chk


Chesapeake Energy Corporation (Chesapeake) is a natural gas and oil exploration and production company. Chesapeake is engaged in the exploration, development and acquisition of properties for the production of natural gas and oil from underground reservoirs. It also provides substantial marketing, midstream, drilling and other oilfield services. Its operations are located onshore and in the continental United States. As of December 31, 2011, the Company owned interests in approximately 45,700 producing natural gas and oil wells that produced approximately 3.5 billion cubic feet of natural gas equivalent per day, net to its interest. It operates in three segments: exploration and production; marketing, gathering and compression, and oilfield services. In March 2011, it sold all of its Fayetteville Shale assets. In July 2012, it sold its interest in Chesapeake Midstream Partners, L.P. to Global Infrastructure Partners. In October 2012, it sold asset packages in the Permian Basin.
Confident Investor comments: At this price and at this time, I do not think that a Confident Investor can confidently invest in this stock. It is not possible to confidently invest in a company that is not currently profitable.

If you would like to understand how to evaluate companies like I do on this site, please read my book, The Confident Investor.