A stock exchange is similar to an auction house. If you collected rare coins and saw that a leading auction house had coins to sell, you could attend the auction. You would compete with other interested buyers for the coins. The buyer who agreed to pay the highest price would acquire the coins.

Probably a bit more relevant to your everyday experience is when you buy something on eBay (NASDAQ:EBAY). With eBay, you can set the minimum and maximum you will pay for the item. As other bidders enter the market, they can bid against you with eBay’s automatic bid tool until one of you reaches your personal maximum; the most that you think the item is worth. At that point, one bidder will be the current leader and others will have to bid against the leader.

At any time during the auction, an interested bidder on eBay could value the item more and increase the bid to be the leader. The winner of the item is the person with the largest bid at the end of the auction deadline set by the seller.

The stock market is larger and more efficient than eBay!

The auction example doesn’t quite hold for stock price, though, as there are no deadlines. Also, buyers may immediately become sellers. It is similar in that the stock price is set by the number of people who want to sell their shares at the current price and those who want to buy the stock at that price.

If an investor wants to sell shares of a company, he looks at the current share price and determines if it is in his best interest to sell the stock. If it is, he will sell it. If he needs a higher price to sell the shares to meet his goals, he will hold on to the stock. If no investors want to sell their shares at a given price, then no buyers will be able to buy shares. This will cause the price to increase until some investor somewhere thinks the price is high enough to sell.

The converse is also true. There are times when potential investors believe that a stock’s price is too high to be a suitable investment. At the same time, there are shareholders who want to sell the stock. In this case, the price will go down until some investor wishes to buy the stock. Most stocks huge volume changing hands in any given day so there is little delay between the buying and selling of a stock.

This makes the market extremely efficient but a little chaotic. Every investor has a different way to analyze the company and determine if it is wise to invest. Also, every investor has separate outside influences in spending money, which includes other investment options. With the diverse range of influences and opinions of thousands or millions of investors, the market may be quite volatile. Prices can change a few percentage points each day on the most stable of days and move even farther on days when there is a significant amount of activity.

The good news for you, the individual investor, is that you do not need to understand all of this background theory. You simply need to understand that when you want to buy a stock you can buy it. The price may be better or worse tomorrow though so it is important to try to buy the stock at a discount. This is where my book, The Confident Investor, can help. You can purchase my book wherever books are sold such as Amazon, Barnes and Noble, and Books A Million. It is available in e-book formats for Nook, Kindle, and iPad.

Editors Note: I frequently get asked on Twitter or via my Contact page why a certain stock “gapped up” or “gapped down” and if the investor should react to it. It is important to understand the nature of gaps and Zachary does an excellent job of explaining the basics.

Guest Post by 

Gaps occur because something has significantly changed the forces of supply and demand for a particular security. When price gaps up, sellers are no longer willing to part with shares at the currently traded price or the closing price from the day prior. When price gaps down, buyers are refusing to exchange shares of the currently traded price or closing price from the day prior. Both of these events usually stem from pertinent news about the immediate past or future of the security in question, and since the market is considered a leading indicator, the largest gaps come from changes in the future guidance of that particular security.

Let’s take a look at a quick example, XYZ Inc. in its most recent earnings report comes out with a new product that is slated to considerably improve the company’s future earnings and possibly create a brand-new market segment. The lucky people who have the shares are now unwilling to sell them at the prior days close and one in extra three dollars to part with their shares. Demand for the shares pick up as buyers, wanting to be a part of the company’s burgeoning growth potential, happily pay the extra three dollars for the shares. When the market opens the next day a gap up occurs for exactly 3 dollars. This type of gap may end up being what’s called a breakaway gap, where price has lain dormant for some time but this fresh news’s barks at torrent of new demand for the shares. There are also three other kinds of gaps that will discuss in the coming section and those are common gaps, runaway gaps, an exhaustion gaps.

Common Gaps
Common gaps also referred to as an area gap or trading gap, occur with no real catalyst about the future of the security in question. These types of gaps usually occurred during uneventful times and most commonly when volume for a particular security is low, referred to as being thinly traded. An example of a common gap may be a security that has an upcoming ex-dividend date where volume falls off and inexperienced market participants are willing to pay whatever price is being offered. These types of inefficiency gaps are usually “filled” very quickly, meaning that price will retrace to the close of the day prior to the gap. When this happens it is known as “filling the gap”. Sometimes you’ll hear traders say that Gaps HAVE to be filled, but this is mainly due to an old methodology of thinking or marketing experience.

Breakaway Gaps
Breakaway gaps occur during exciting times in a security’s life and are usually accompanied by high volume. For a gap to be considered a breakaway gap, the security’s past price data has to of been going sideways for a while, this is also referred to as an area of congestion where price move sideways usually within a defined range continually bouncing off support and resistance. For price to move sideways, key support and resistance lines are usually horizontal with buyers coming in when price touches the support line and sellers dumping shares at the resistance line. Price can remain in this range for weeks, months, and even years, and as time passes the support and resistance lines become even more entrenched making it harder for price to escape. Fresh market enthusiasm, usually accompanied by spike in volume, is necessary for price to finally escape this range and the resultant gap usually occurs because traders accustomed to the range will have to quickly cover their positions to mitigate losses. This is one of the reasons why these gaps can be some of the largest.

Runaway Gaps
Runaway gaps are also caused by an increase in market enthusiasm for a particular security, but have one main difference from breakaway gaps in that they usually occur during a well-defined up or downtrend. A runaway gap to the upside usually represents market participants who waited on the sidelines during the initial trend, sitting on their laurels waiting for a pullback to get in too long positions. But there’s only one problem, price steadily continues upward and all the sudden the anxiety of missing the move becomes too much to handle. In a rush to get in, buyers are falling over each other paying whatever price sellers are demanding resulting in a runaway gap to the upside. Runaway Gaps commonly have significantly higher volume on days before and after the gap. Getting into positions after a runaway gap occurs can be difficult due to increase price volatility as market participants with early entry book profits.

Exhaustion Gaps
Exhaustion gaps are the evil cousin of runaway gaps in that they occur at the end of a long-standing trend and may signal a reversal of the trend. Exhaustion gaps are commonly identified by massive spikes in volume that can be many multiples of the securities average trading volume. Exhaustion gaps are the most profitable gaps to trade because there’s so much emotion involved in the last gasps of the trend that people who were waiting on the sidelines for the trend to end, come in guns a blazing securing a premium spot for their stop losses.

I hope that you enjoyed my analysis of “The Big 4” Gaps in trading. If you would like to learn more about technical analysis as well as how to apply it in Day Trading please visit my website where I teach Day Trading Strategies in video webinar format. Here’s the best part… It’s free! Enjoy

Website: http://www.thetechnicaldaytrader.com

Day trading Video Blog: http://www.thetechnicaldaytrader.com/DayTrading-VideoBlog.aspx

Article Source: http://EzineArticles.com/?expert=Zachary_D_Brethauer

Editors Note: An investor needs to be very concerned about having too many stocks that are influenced by the same market factors. Understanding these relationships can be confusing at times. This guest article by Troy does an excellent job of helping to explain this concept.

Guest Post by Troy Huot

Why do stocks trade up? Why do stocks trade down? When you invest in a stock you need to comprehend what jolts the equity you’ve investing in either higher or lower. One contributing factor may have nothing to do with the stock you own at all.

Arbitrage is not usually the reason your beloved stock gets hammered on any given day. The old adage, “everything happens for a reason” definitely holds true in relation to the stock market. Stocks trade in unison and typically stocks trade in unison by sector.

Stocks can be divided up into many sectors based on the type of business the company is involved in. Some sectors include, but are not limited to: energy, financial, health care, industrials, retail and technology. It is imperative that you know what sector your stock belongs to as the stock can increase or decrease in value based on competitors in their sector.

For example, Apple is in the technology sector and its direct competitors are Dell [stckqut]DELL[/stckqut] and Hewlett-Packard [stckqut]HPQ[/stckqut]. News could come out that Apple Macbook Pro computer sales are going to be lower than expected this quarter. As a result, the stock could sell off drastically. You could trade the news on Apple [stckqut]AAPL[/stckqut] knowing there is also a possibility that both Dell and Hewlett-Packard could decrease in price too. Why? Because investors will insinuate that the decrease in sales for Apple is a foreshadow for dismal computer sales for both Dell and Hewlett-Packard. This has a direct impact on all the companies which leads to a rainfall effect that could send all three stocks trading lower.

There are also many other indirect stock market links that investor’s must pay attention to. Apple and Hewlett-Packard may be directly connected but companies like Apple and Omnivision Technologies [stckqut]OVTI[/stckqut] have an indirect relationship. Omnivision Technologies creates and manufactures a semiconductor image sensor for the camera used in Apple iPhones: do you see the relationship here? It could come to light that iPhone sales have increased dramatically from first quarter to second quarter. This could lead to Apple’s share increasing in price as well as Omnivision Technologies stock since Apple uses Omnivision’s product in their iPhone.

Stocks trade higher and lower based on several other reasons including current commodity prices. If you are an owner of apparel maker, Lululemon Athletica [stckqut]lulu[/stckqut], then it is in your best interest to monitor the price of cotton. If the price of this commodity escalates, odds are Lululemon will trade lower due to the fact the company now has to pay more money to purchase cotton. Cotton is the main fabric used in clothing so it’s price can have a huge positive or negative impact on retail companies. If cotton costs increase for a clothing company but the price of merchandise sold remains the same then profitability will decrease which might disgruntle investors. A company like Lululemon can not simply just increase their price of a hoody or yoga pant either. Doing this could lead to losing customers to competitors which would hurt the company even more. Many clothing manufacturers like Nike [stckqut]NKE[/stckqut], Under Armour [stckqut]UA[/stckqut] and True Religion [stckqut]TRLG[/stckqut] could also perish from higher commodity prices and this is why stocks in similar sectors tend to trade together.

As an investor you must always be observant and understand direct and indirect relationships between companies that makes stocks trade together. This will indubitably help make you more money during your investing lifetime. Nonetheless, this will also help prevent you from making some terrible mistakes in the future which will have a direct, and indirect, impact on your bank account.
Like what you read? Find more related articles and content at http://www.conquerinvesting.com

Article Source: http://EzineArticles.com/?expert=Troy_Huot

Many people need to focus on not spending money on things that they do not need. This desire to spend, in some cases, has severely affected the ability to develop an Emergency Fund as well as create an investment portfolio. Even if you read my book, The Confident Investor, I cannot help you if you are not setting aside money on a regular basis to invest in your financial well-being.

I recently read an article on The Simple Dollar that helps with this problem. If you find that you (or members of your family) feel like money is burning a hole in your pocket, jump over and read this article. The two points that I thought were most interesting:

  1. Don’t buy anything without coming up with 5 reasons to not buy it!
  2. Wait ten seconds before putting anything into your cart.

The article suggests 4 questions that you should ask yourself before every purchase:

  1. Can I find this exact item at a lower price elsewhere?
  2. Do I have something similar to this that’s unused or underused at home?
  3. Will I actually enjoy this?
  4. What’s wrong with this item?

It is a very good article. Jump over and learn how to control your spending urges.

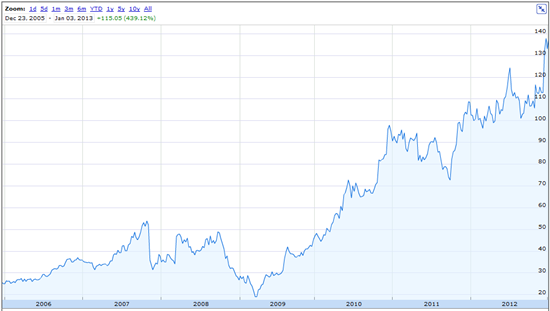
In a 7 year time frame from January 3, 2006 to December 31, 2012, Boston Beer [stckqut]SAM[/stckqut] increased 433.4% if you would have implemented a pure buy-and-hold strategy. If you would implemented the strategy that I explain in my book, The Confident Investor, you would have seen a 550.6% return on your investment. This is a 27.0% increase on the profit percentage.

To put it into actual dollars, suppose you invested $10,000 in SAM on 1/3/2006. With the system that is explained in The Confident Investor, you would have exited the market on 12/31/2012 with $77,006.32. With my system, it is not uncommon for you to need a bit more cash available to cover the ongoing trades. Therefore, rather than $10,000, you would have needed $11,836.98. You would have 502 shares which were purchased with other people’s money and still have your original $10,000.

To be fair in our comparison, the buy-and-hold method if calculated with $11,836.98 would have ended up with $63,136.04 and a respectable 433.4%. You would have purchased 473 shares but your original $11,836.98 would be tied up in the stock.

The profit on the buy-and-hold strategy in this scenario is $51,299.72.  The profit using GOPM (Grow on Other People’s Money) is $65,170.64.  That means the increased profit on SAM in this time frame was $13,870.92. This means your profit INCREASED by 27.0%!!

Understanding buy-and-hold is easy. You have a given amount of money, in this case $11,836.98. You buy 473 shares at the start of the test period. At the end of the test period, you sell the shares and the profit (or loss) is the standard that any other system must beat.

Understanding GOPM is a bit more complicated without reading my book, The Confident Investor. Before you even start to invest, the system teaches you to look for incredibly well-run companies and only invest in those companies. While SAM may or may not have qualified for this status in 2006, it does in 2013 so we are simply back-testing against a currently well-run company. While past performance doesn’t guarantee future performance, it is probably the best tool that we have to understand investment methodologies.

After you find a well-run company, you are going to buy $10,000 worth of shares when the technical indicators tell you that the stock has upward momentum. You are then going to sell those shares when that momentum slows down or reverses.  The profit that you make on that transaction, you will keep in the stock (in other words, you are not going to sell those shares). You are going to keep the $10,000 ready for when the stock has the correct momentum. If there is any excess profit (e.g. less than the value of a full share after keeping the $10,000) you will just stick that into your money-market account in this example. It is possible that you could invest this excess amount but we are going to simplify this example and just hold that money.

As a quick example, you invest $10,000 in a stock trading at $50 per share so you have purchased 200 shares.  Over the course of the next several days or weeks, the stock price increases to $55 which is where you decide to sell. To get your original capital of $10,000 back, you sell 182 shares resulting in $10,010 in your account and 18 shares that are essentially free since they were purchased with Other People’s Money. You now have your original capital of $10,000, 18 free shares and an additional $10.

Using this technique, you will make several trades per year and may even be trading weekly. Therefore, to make this model fair, I need to account for stockbroker fees and commissions.  In this example, I am using $8 for every sell and for every purchase. You may have a better fee from your favorite broker but $8 seems fair for a test. Frankly, if you are paying more than $10 for each transaction then you probably need to be looking at another broker!

Using this technique, by the end of the test on 12/31/2012 you would have 502 shares of SAM that cost you $1,836.32. Those 502 shares were acquired for $3.658 per share! This is significantly cheaper than today’s stock price and no matter what happens to SAM you could probably sell these shares for a profit at any time! You would still have the original $10,000 in your bank account! This is because you have purchased these share with Other People’s Money.  This is why I call my system GOPM – Grow on Other People’s Money.

If you would have invested in Boston Beer as described in this article, you would have doubled your investment by August 14, 2009. By that date, you would have acquired 255 shares of SAM which were valued at about $39.78 for a total profit of $10,142.63. This means your $10,000 initial investment would have doubled.

The rest of this article shows each buy and sell transaction for those 7 years. It shows the date, the assumed purchase price on that day (taken from Yahoo – the purchase price is the average of the opening and closing price on that day) and the profit or loss. If you haven’t read my book, The Confident Investor, then you may not understand the timing of the trades. In fact, if you haven’t purchased the book and registered here on this site as a book owner then you won’t be able to see those individual trades. If you have registered and cannot see the trades, make sure you are logged in and refresh your browser.

Which brings me to the big set of questions. Shouldn’t you own this book? Does your investment strategy beat buy-and-hold? Do you even have an investment strategy? If your strategy beats buy-and-hold, does it beat GOPM – Growing on Other People’s Money?

You can purchase my book wherever books are sold such as Amazon, Barnes and Noble, and Books A Million. It is available in ebook formats for Nook, Kindle, and iPad. It may be available at your favorite bookstore as well but you may have to ask.

SAM 6 year chart from Google Finance

SAM chart


[s2If current_user_can(s2member_level1)]

Description of SAM trades table

While it may be obvious the meaning of the various columns, some of them definitely need a bit of explanation if you have never walked through a trading analysis with me.

Date – The date of the trade. It is important to note the long delays between trades. This will help you with your portfolio since you do not have to dedicate your average trade purchase (in this case $10,000) to just one stock but rather you can invest that money in the hottest stock at the time.

Buy/Sell – This is probably pretty obvious. On this date, did the system buy or sell the stock? The SELL will only sell from the previous transaction’s BUY.

Purch. Price – The selling or buying price of this transaction. This is taken from Yahoo’s Historical Pricing page and it is the average of the opening and closing price on that day.

Shares purchased – The number of shares that $10,000 will buy on that day.

Invested – The amount that was actually purchased. This is the number of shares (the previous column) multiplied by the Purch. Price column.

Returned – When you sell the shares from the previous BUY, the amount of money that results.

Profit/Loss – How much was profited from the previous BUY.

Free shares – If the SELL was profitable, how many shares was evenly divides into this profit.  These are free shares as they were purchased with Other People’s Money.

Excess – After the Free Shares are taken out, how much money is left over. If the transaction was not profitable, then what was the loss.

Running investment balance – A running total of the value of the investment.


SAM trades table


Date Action Purchase price Shares purchased Invested Returned Profit / Loss Free shares Excess Running investment balance
01/19/06 BUY 26.055 383 9979.065 0
01/25/06 SELL 26.03 9961.49 -17.575 -17.575 -17.575
02/15/06 BUY 26.12 382 9977.84 -17.575
02/22/06 SELL 25.875 9876.25 -101.59 -101.59 -119.165
02/27/06 BUY 25.93 385 9983.05 -119.165
03/06/06 SELL 26.275 10107.875 124.825 4 19.725 -99.44
03/08/06 BUY 26.525 376 9973.4 -99.44
03/16/06 SELL 26.935 10119.56 146.16 5 11.485 -87.955
03/23/06 BUY 27.205 367 9984.235 -87.955
03/27/06 SELL 26.905 9866.135 -118.1 -118.1 -206.055
04/05/06 BUY 27.23 366 9966.18 -206.055
04/10/06 SELL 26.92 9844.72 -121.46 -121.46 -327.515
04/19/06 BUY 27.27 366 9980.82 -327.515
04/27/06 SELL 27.1 9910.6 -70.22 -70.22 -397.735
05/03/06 BUY 27.24 366 9969.84 -397.735
05/08/06 SELL 27.095 9908.77 -61.07 -61.07 -458.805
05/31/06 BUY 26.82 372 9977.04 -458.805
06/05/06 SELL 26.71 9928.12 -48.92 -48.92 -507.725
06/20/06 BUY 27.04 369 9977.76 -507.725
07/13/06 SELL 29.005 10694.845 717.085 24 20.965 -486.76
07/31/06 BUY 29.09 343 9977.87 -486.76
08/29/06 SELL 31.54 10810.22 832.35 26 12.31 -474.45
09/15/06 BUY 33.625 297 9986.625 -474.45
09/22/06 SELL 33.51 9944.47 -42.155 -42.155 -516.605
10/11/06 BUY 33.1 301 9963.1 -516.605
11/01/06 SELL 36.01 10831.01 867.91 24 3.67 -512.935
11/22/06 BUY 35.71 279 9963.09 -512.935
11/28/06 SELL 35.695 9950.905 -12.185 -12.185 -525.12
11/29/06 BUY 35.785 279 9984.015 -525.12
12/15/06 SELL 36.465 10165.735 181.72 4 35.86 -489.26
03/20/07 BUY 34.315 291 9985.665 -489.26
03/28/07 SELL 33.62 9775.42 -210.245 -210.245 -699.505
05/08/07 BUY 34.2 292 9986.4 -699.505
06/07/07 SELL 38.09 11114.28 1127.88 29 23.27 -676.235
06/14/07 BUY 39.63 252 9986.76 -676.235
06/22/07 SELL 39.255 9884.26 -102.5 -102.5 -778.735
07/03/07 BUY 40.19 248 9967.12 -778.735
07/18/07 SELL 41.155 10198.44 231.32 5 25.545 -753.19
08/02/07 BUY 42.275 236 9976.9 -753.19
08/14/07 SELL 43.99 10373.64 396.74 9 0.83 -752.36
08/17/07 BUY 46.75 213 9957.75 -752.36
09/07/07 SELL 47.21 10047.73 89.98 1 42.77 -709.59
09/19/07 BUY 47.185 211 9956.035 -709.59
09/21/07 SELL 47.33 9978.63 22.595 0 22.595 -686.995
09/28/07 BUY 48.83 204 9961.32 -686.995
10/19/07 SELL 52.72 10746.88 785.56 14 47.48 -639.515
02/04/08 BUY 37.695 265 9989.175 -639.515
02/15/08 SELL 37.235 9859.275 -129.9 -129.9 -769.415
02/27/08 BUY 37.27 268 9988.36 -769.415
07/08/08 SELL 41.06 243 9977.58 -769.415
07/15/08 BUY 40.86 9920.98 -56.6 -56.6 -826.015
07/21/08 SELL 41.69 239 9963.91 -826.015
08/04/08 BUY 44.845 10709.955 746.045 16 28.525 -797.49
08/12/08 SELL 45.475 219 9959.025 -797.49
08/20/08 BUY 45.045 9856.855 -102.17 -102.17 -899.66
09/16/08 SELL 45.3 220 9966 -899.66
10/01/08 BUY 46.795 10286.9 320.9 6 40.13 -859.53
04/08/09 SELL 22.955 435 9985.425 -859.53
05/28/09 BUY 28.24 12276.4 2290.975 81 3.535 -855.995
06/03/09 SELL 29.525 338 9979.45 -855.995
06/10/09 BUY 29.48 9956.24 -23.21 -23.21 -879.205
06/25/09 SELL 29.06 343 9967.58 -879.205
07/07/09 BUY 29.74 10192.82 225.24 7 17.06 -862.145
07/15/09 SELL 29.89 334 9983.26 -862.145
07/17/09 BUY 29.825 9953.55 -29.71 -29.71 -891.855
07/23/09 SELL 29.81 335 9986.35 -891.855
08/28/09 BUY 40.09 13422.15 3435.8 85 28.15 -863.705
10/21/09 SELL 38.76 257 9961.32 -863.705
10/28/09 BUY 39.095 10039.415 78.095 1 39 -824.705
11/06/09 SELL 39.855 250 9963.75 -824.705
12/07/09 BUY 42.97 10734.5 770.75 17 40.26 -784.445
12/18/09 SELL 45.175 221 9983.675 -784.445
01/15/10 BUY 48.32 10670.72 687.045 14 10.565 -773.88
02/18/10 SELL 47.185 211 9956.035 -773.88
03/12/10 BUY 49.975 10536.725 580.69 11 30.965 -742.915
03/23/10 SELL 52.165 191 9963.515 -742.915
04/26/10 BUY 57.01 10880.91 917.395 16 5.235 -737.68
05/11/10 SELL 58.79 169 9935.51 -737.68
05/20/10 BUY 58.665 9906.385 -29.125 -29.125 -766.805
05/27/10 SELL 63.295 157 9937.315 -766.805
06/22/10 BUY 72.565 11384.705 1447.39 19 68.655 -698.15
07/09/10 SELL 69.74 143 9972.82 -698.15
07/15/10 BUY 69.48 9927.64 -45.18 -45.18 -743.33
07/23/10 SELL 70.51 141 9941.91 -743.33
07/29/10 BUY 70.65 9953.65 11.74 0 11.74 -731.59
09/08/10 SELL 67.475 148 9986.3 -731.59
09/22/10 BUY 67.965 10050.82 64.52 0 64.52 -667.07
10/15/10 SELL 68.59 145 9945.55 -667.07
12/29/10 BUY 97.255 14093.975 4148.425 42 63.715 -603.355
02/04/11 SELL 93.055 107 9956.885 -603.355
02/09/11 BUY 92.3 9868.1 -88.785 -88.785 -692.14
02/15/11 SELL 93.925 106 9956.05 -692.14
02/22/11 BUY 94.325 9990.45 34.4 0 34.4 -657.74
03/03/11 SELL 94.3 105 9901.5 -657.74
03/09/11 BUY 88.45 9279.25 -622.25 -622.25 -1279.99
03/31/11 SELL 91.99 108 9934.92 -1279.99
04/08/11 BUY 92.065 9935.02 0.1 0 0.1 -1279.89
04/19/11 SELL 91.9 108 9925.2 -1279.89
05/02/11 BUY 93.52 10092.16 166.96 1 73.44 -1206.45
06/21/11 SELL 87.17 114 9937.38 -1206.45
07/27/11 BUY 90.955 10360.87 423.49 4 59.67 -1146.78
10/10/11 SELL 83.11 120 9973.2 -1146.78
11/15/11 BUY 98.385 11798.2 1825 18 54.07 -1092.71
12/01/11 SELL 100.265 99 9926.235 -1092.71
01/03/12 BUY 107.29 10613.71 687.475 6 43.735 -1048.975
02/06/12 SELL 104.615 95 9938.425 -1048.975
02/09/12 BUY 102.715 9749.925 -188.5 -188.5 -1237.475
02/22/12 SELL 102.55 97 9947.35 -1237.475
03/22/12 BUY 100.135 99 9913.365 -1237.475
04/04/12 SELL 104.075 10295.425 382.06 3 69.835 -1167.64
05/02/12 BUY 107.215 93 9970.995 -1167.64
05/16/12 SELL 105.825 9833.725 -137.27 -137.27 -1304.91
06/06/12 BUY 106.64 93 9917.52 -1304.91
07/09/12 SELL 118.135 10978.555 1061.035 8 115.955 -1188.955
09/28/12 BUY 112.535 88 9903.08 -1188.955
10/01/12 SELL 108.25 9518 -385.08 -385.08 -1574.035
10/19/12 BUY 109.195 91 9936.745 -1574.035
10/22/12 SELL 107.855 9806.805 -129.94 -129.94 -1703.975
11/02/12 BUY 113.79 87 9899.73 -1703.975
11/12/12 SELL 112.045 9739.915 -159.815 -159.815 -1863.79
12/14/12 BUY 131.19 76 9970.44 -1863.79
12/27/12 SELL 135.215 10268.34 297.9 2 27.47 -1836.32

[/s2If]