Gold prices have dropped a bit in the last couple months. This has caused some consternation among some investors. This is utterly foolish!

My gut is investing in gold right now is not particularly logical. It unquestionably is trending down. That is unwelcome news for some of the gold mines, but it is hardly a concern for a Confident Investor. We can easily invest in other companies that are doing well and are not subject to the whims of a commodity price. If you read this site even for a short time, you should know that I don’t like a “Buy and Hold” investment strategy.

Historically, gold was used as a safeguard against risk in the financial world. It was seen as a safe harbor when there was uncertainty in other investments. This was one of the principal reasons given when gold was growing so quickly from the beginning of 2006 to mid-2011. Then as the economy stopped hurting so badly, the price leveled off in late 2011 and 2012. It is not surprising, in fact it is expected, the price would drop with a stable economy.

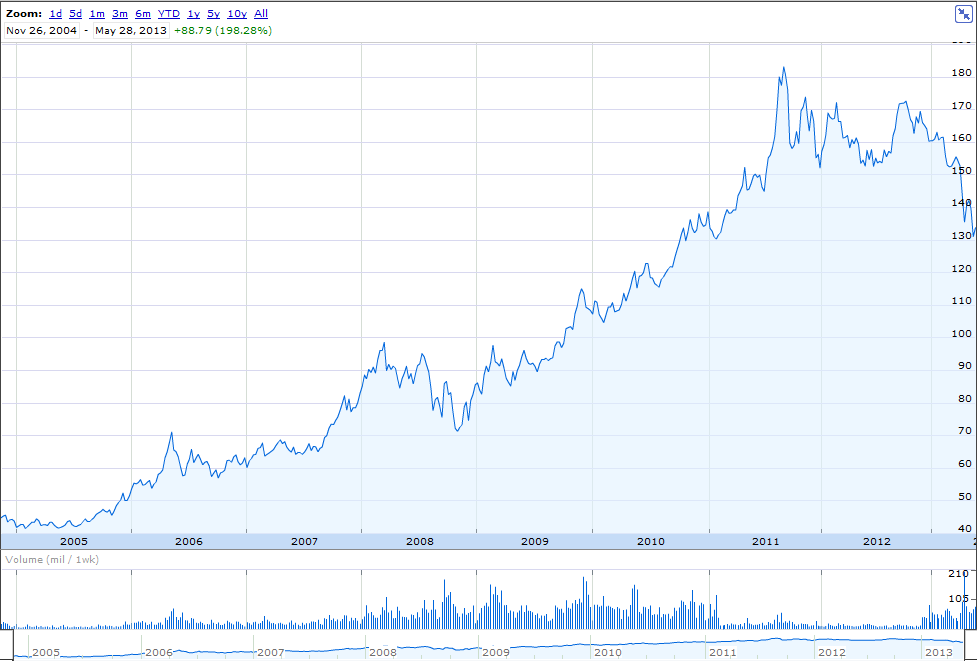
As we look at the Gold ETF [stckqut]GLD[/stckqut], this is exactly what we see. There is quite a bit of volume as the price increases into 2011. Then, the volume drops substantially as the price oscillates in a sideways channel. Now the volume has increased as the price drops. What this shows is that money was flowing into this investment vehicle, it was be held, and now it is flowing out. The new home for that money is not currently clear but maybe it is the reason the stock market has been breaking records lately.

NYSEARCA GLD SPDR Gold Trust ETF from Google Finance

Many will point out that the economy is not as strong as it could be. That is fine. I won’t argue that point. However, the economy has been fairly stable for at least the last 12 months with a extremely slow recovery and painfully slow reduction in unemployment. The economy is not getting worse, and by most measures it is holding its own or slightly improving.

A while back I suggested that you should not invest based on politics or economic announcements. Gold is an economic announcement. You should watch it and understand it, but trying to decipher how it is going to move Google [stckqut]GOOG[/stckqut], Apple [stckqut]AAPL[/stckqut] or Ebay [stckqut]EBAY[/stckqut] is a fool’s errand.

Company name Google Inc
Stock ticker GOOG
Live stock price [stckqut]GOOG[/stckqut]
P/E compared to competitors Good

MANAGEMENT EXECUTION

Employee productivity Fair
Sales growth Good
EPS growth Good
P/E growth Poor
EBIT growth Good

ANALYSIS

Confident Investor Rating Good
Target stock price (TWCA growth scenario) $1349.35
Target stock price (averages with growth) $1757.36
Target stock price (averages with no growth) $1269.54
Target stock price (manual assumptions) $1138.96

The following company description is from Google Finance: http://www.google.com/finance?q=goog

Google Inc. (Google) is a global technology company focused on improving the ways people connect with information. The Company generates revenue primarily by delivering online advertising. As of December 31, 2011, the Company’s business was focused on areas, such as search, advertising, operating systems and platforms, and enterprise. Businesses use its AdWords program to promote their products and services with targeted advertising. In addition, the third parties that comprise the Google Network use its AdSense program to deliver relevant advertisements that generate revenue. In May 2012, Google acquired Motorola Mobility Holdings, Inc. As of January 2012, over 90 million people had joined Google+. n April 2013, Google Inc acquired Wavii. In May 2013, Google Inc acquired an undisclosed minority stake in LendingClub Corp. In May 2013, Google Inc acquired Makani Power.


Confident Investor comments: At this price and at this time, I think that a Confident Investor can confidently invest in this stock.

If you would like to understand how to evaluate companies like I do on this site, please read my book, The Confident Investor.

The first step in investing is finding a good company. As an investor, you cannot afford to own companies that have a Chevrolet attitude – good enough to get you from here to there. Instead, you must only invest in companies that are like Porsche, Lamborghini, and Bentley – absolutely and without doubt the best in their class.

To continue that car analogy, let’s pretend you would like to buy a used car. Most people would only buy a used car after they have investigated the Vehicle Identification Number. Typical car buyers make sure that it has never been in an accident, that it does not have significant signs of rust, and that the engine seems to be in working order. You might also get a professional to look at the car. While there are no guarantees that your newly-purchased used car will not have a problem, you take precautions against the unknown with substantial research. The same is true when you buy a company.

The major indicators of a “Bentley” company are relatively easy to understand. Unfortunately, the one indicator that everyone seems to talk about is almost meaningless. A company with a low price does not make it an excellent investment. A car may seem cheap, but if it breaks down two weeks after purchase, then it is a lousy deal no matter what price you paid. You want to pay a fair price and be reasonably confident the company will thrive.

The most critical metric of any company is that it is currently profitable. Never buy a company that is not running its operation at a profit. If a company lost money for the past 12 months (often referred to as “trailing twelve months” or TTM), then you should not buy the company. Do not bother with any analysis for a company that does not make money! Just go to another investment possibility.

The major indicators of a healthy company are:

  1. The growth of the company’s sales.
  2. The growth of the company’s earnings per share of stock outstanding.
  3. The growth of the company’s market value compared to its earnings.
  4. The growth of the company’s earnings before taking into account interest and taxes.
  5. The value of the company compared to its earnings as compared to other similar companies.
  6. The productivity of the company employees relative to industry averages.

You can download a worksheet for this on the web by going to http://www.Confident-Investor.com/analysis-worksheet. You will need to be a registered book owner to access this page but you can register easily and for free by following the instructions on the site.

Common accounting practice and the rule of law in the US requires that public companies publish the core data behind these metrics. In some cases, you can find this information on the company’s investor portion of their website. My book, The Confident Investor, will reference sites that have compiled and display this public information.

As you calculate each of the values, write them down on a piece of paper (or use the worksheet at http://www.Confident-Investor.com/analysis-worksheet). You will apply a standard against each value and a resulting score. By combining all of the scores, you can decide if you can confidently invest in this company.

This is exactly the process that I go through for my daily posts on different companies that I review on this site. These 6 metrics plus profitability are all you need to separate “Chevrolet” companies from “Bentley” companies.