Symbol Stock Price change today
SUI Sun Communities Inc. Common St 1.47%
STZ Constellation Brands Inc. Comm 1.23%
CBPO China Biologic Products Inc. 1.14%
GTN Gray Communications Systems In 1.03%
ALGN Align Technology Inc. 0.99%
HDSN Hudson Technologies Inc. 0.92%
DPZ Domino’s Pizza Inc Common Stock 0.91%
MNST Monster Beverage Corporation 0.67%
HZO MarineMax Inc. (FL) Common St 0.47%
EXR Extra Space Storage Inc Common 0.46%
SBUX Starbucks Corporation 0.46%
ABMD ABIOMED Inc. 0.36%
AZPN Aspen Technology Inc. 0.36%
CVCO Cavco Industries Inc. 0.35%
SWKS Skyworks Solutions Inc. 0.27%
CRUS Cirrus Logic Inc. 0.22%
AMZN Amazon.com Inc. 0.20%
TRN Trinity Industries Inc. Common 0.12%
BWLD Buffalo Wild Wings Inc. 0.10%
AMAT Applied Materials Inc. 0.08%
NVDA NVIDIA Corporation 0.06%
HSKA Heska Corporation -0.08%
ULTA Ulta Beauty Inc. -0.11%
LULU lululemon athletica inc. -0.13%
GOOGL Alphabet Inc. -0.13%
LNCE Snyder’s-Lance Inc. -0.15%
UA Under Armour Inc. Class C Comm -0.17%
AYI Acuity Brands Inc (Holding Comp -0.21%
SAM Boston Beer Company Inc. (The) -0.25%
TMO Thermo Fisher Scientific Inc Co -0.28%
FB Facebook Inc. -0.33%
PCLN The Priceline Group Inc. -0.41%
AAPL Apple Inc. -0.44%
MIDD The Middleby Corporation -0.44%
BABA Alibaba Group Holding Limited A -0.47%
ALXN Alexion Pharmaceuticals Inc. -0.51%
GWR Genesee & Wyoming Inc. Class A -0.65%
MEI Methode Electronics Inc. Commo -0.70%
MRK Merck & Company Inc. Common St -0.84%
THRM Gentherm Inc -0.86%
EW Edwards Lifesciences Corporatio -0.96%
COF Capital One Financial Corporati -1.33%
MET MetLife Inc. Common Stock -1.37%
REGN Regeneron Pharmaceuticals Inc. -1.98%
NFLX Netflix Inc. -2.64%
HOG Harley-Davidson Inc. Common St -4.19%
MCK McKesson Corporation Common Sto -4.59%

Today is Tax Day. You may have already paid your taxes and told the government how much you earned and therefore paid. However, if you haven’t done it before today – you need to settle up with the US Government (and most states/cities/counties/etc.). With April 18 finally here, U.S. taxpayers are likely asking themselves:

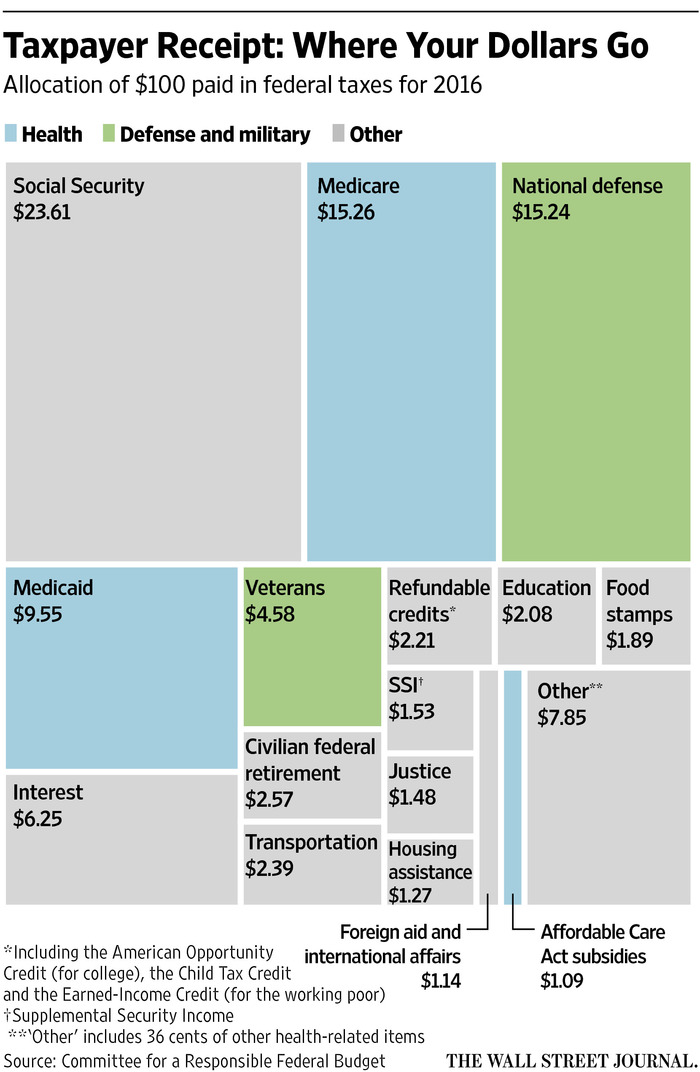
Where exactly are my tax dollars going?


To answer the question, here is a “Taxpayer Receipt” showing how each $100 of taxes was spent, both for 2016 and five years earlier. It was prepared by the Committee for a Responsible Federal Budget (CRFB), a nonpartisan nonprofit group in Washington that monitors federal spending. The group’s three chairmen are Republican Mitch Daniels, Democrat Leon Panetta and independent Tim Penny.

Looking at the list of expenditures, it is clear why some say the U.S. is a giant insurance company with an army. Half of all spending goes for Social Security benefits and health programs such as Medicare and Medicaid, while another 20% is for defense and military benefits.

In the last five years, the shares of spending for Social Security, Medicare and Medicaid have each risen more than 15%. Social Security and Medicare increased largely due to the aging of the population, while the increase in Medicaid comes from aging, growth in health-care costs and expanded eligibility under the Affordable Care Act, also known as Obamacare.

Over the same period, the share devoted to national defense dropped 22%, in part because Congress reduced war spending and capped other military spending in 2011, according to CRFB senior staffer Marc Goldwein.

The tax figures include all federal revenue. The individual income tax provided nearly half the total (47%), while payroll taxes kicked in about one-third (34%). The rest came from corporate income taxes (9%) and other levies such as customs duties and excise taxes (9%).

Source: How $100 of Your Taxes Are Spent: 8 Cents on National Parks and $15 on Medicare – WSJ

[s2If !current_user_can(access_s2member_level1)]This information is exclusively for the registered owners of my book, “The Confident Investor” and will not be visible to other visitors to this site (you must be logged in to this site as a book owner in order to see the following analysis).

If you have registered and cannot see the technical indicators on each stock of my Watch List below, make sure you are logged in and refresh your browser.

As an example of the success that my book teaches, in a 7 year time frame from January 3, 2006 to December 31, 2012, Decker Corporation increased 304.7% if you would have implemented a pure buy-and-hold strategy. If you would implemented the strategy that I explain in my book, The Confident Investor, you would have seen a 371.2% return on your investment. This is a 21.8% increase on the profit percentage.

Can your investment system beat the market by that much?

BL-TCI-cover

You can purchase my book wherever books are sold such as AmazonBarnes and Noble, and Books A Million. It is available in paperback as well as e-book formats for NookKindle, and iPad

[/s2If]

[s2If current_user_can(access_s2member_level1)]Thank you for being a registered book owner. Please remember that the below indicators should NOT be considered signals for you to invest in or sell any of these stocks. Rather, you should double check all analysis and understand that the decision to invest in or sell one of these stocks is purely your own. This information is purely provided for educational purposes.

Read More →