In a recent Wall Street Journal article, Goldman Sachs compared the top 5 companies in 2000 to the top 5 companies today. In that comparison, Goldman concludes that the market is not repeating the problems of 2000 that caused the stock bubble in today’s market.

The top 5 companies in the S&P 500 today are:

  1. Facebook Inc.  [stckqut]FB[/stckqut],
  2. Apple Inc.  [stckqut]AAPL[/stckqut],
  3. Amazon.com Inc.  [stckqut]AMZN[/stckqut],
  4. Microsoft Corp.  [stckqut]MSFT[/stckqut],
  5. Alphabet Inc.  [stckqut]GOOGL[/stckqut].

and of 2000 were:

  1. Microsoft,
  2. Cisco Systems Inc.  [stckqut]CSCO[/stckqut],
  3. General Electric Co.  [stckqut]GE[/stckqut],
  4. Intel Corp.  [stckqut]INTC[/stckqut],
  5. Exxon Mobil Corp.  [stckqut]XOM[/stckqut].

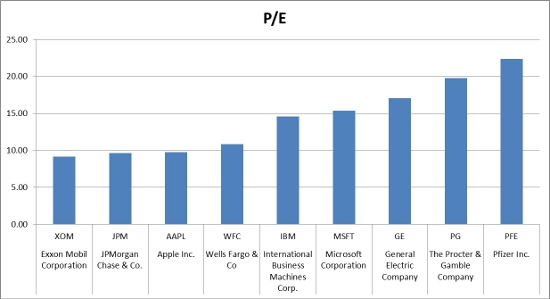
The five companies in 2000 traded at 47 times expected earnings, according to Goldman. Today’s five biggest companies trade at 30 times expected earnings—making them by no means a bargain, but still less expensive than the stocks that dominated the stock run in the early 2000s.

The tech giants powering the S&P 500 today also reinvest far more of their profits into their businesses than their predecessors did. The five companies funnel about 48% of their cash flow from operations into capital expenditure and research and development spending, according to Goldman, well above the S&P 500’s 21% average and the 26% average for the five biggest companies in March 2000.

According to Goldman, “Lower growth expectations, lower valuations and a greater reinvestment ratio suggest the current concentration may be more sustainable than it proved to be in 2000.”

Largest Companies by Revenue in Each State 2015


Thank you to Broadviewnet for putting out this infographic.  Here is the data:

State 2014 Company 2014 Revenue (Billion) 2015 Company 2015 Revenue (Billion) Headquarters
AL Regions Bank $5.89 Regions Bank $5.40 Birmingham AL
AK Alaska Permanent Fund Corporation $4.44 GCI Inc. $0.91 Anchorage AK
AZ Avnet Inc. $25.45 Avnet Inc. $27.49 Phoenix AZ
AR Wal-Mart Stores $476.29 Wal-Mart Stores $485.65 Bentonville AR
CA Chevron Corporation $228.84 Chevron Corporation $211.97 Sam Ramon CA
CO Arrow Electronics Inc. $21.35 Arrow Electronics Inc. $22.78 Inverness CO
CT General Electric $146.04 General Electric $148.58 Fairfield CT
DE E.I du Pont de Nemours and Company $36.14 E.I du Pont de Nemours and Company $36.04 Wilmington DE
FL World Fuel Services $41.56 World Fuel Services $43.38 Miami FL
GA Home Depot International Inc. $85.53 Home Depot International Inc. $85.90 Atlanta GA
HI Hawaiian Electric Industries Inc. $3.23 Hawaiian Electric Industries Inc. $3.23 Honolulu HI
ID Micro Technology Inc. $9.07 Albertson’s LLC. $23.56 Boise ID
IL Archer Daniels Midland $89.80 The Boeing Company $90.76 Chicago IL
IN WellPoint $71.02 Anthem Inc. $73.87 Indianapolis IN
IA Transamerica Life Insurance Company $19.04 Transamerica Life Insurance Company $23.34 Cedar Rapids IA
KS Sprint Communications Inc. $34.56 Koch Industries $115.00 Wichita KS
KY Humana Inc. $42.31 Humana Inc. $48.50 Louisville KY
LA CenturyLink Inc. $18.09 CenturyLink Inc. $18.03 Monroe LA
ME Hannaford Bros. Co. $3.98 Hannaford Bros. Co. $4.41 Scarborough ME
MD Lockheed Martin $45.35 Lockheed Martin $45.60 Bethesda MD
MA Liberty Mutual Holding Company Inc. $38.50 Liberty Mutual Holding Company Inc. $36.94 Boston MA
MI General Motors $155.42 General Motors $155.92 Detroit MI
MN Cargill Inc. $136.65 UnitedHealth Group $130.47 Minnetonka MN
MS Sanderson Farms Inc. $2.68 Koch Foods Incorporated $2.80 Flowood MS
MO Express Scripts Holding $104.09 Express Scripts Holding $100.88 St. Louis MO
MT Stillwater Mining Company $1.03 Stillwater Mining Company $0.94 Billings MT
NE Berkshire Hathaway $182.15 Berkshire Hathaway $194.67 Omaha NE
NV Las Vegas Sands Corp. $13.76 Las Vegas Sands Corp. $14.58 Paradise NV
NH Sprague Resources LP $4.60 C&S Wholesale Grocers Inc. $21.70 Keene NH
NJ Johnson & Johnson $71.31 Johnson & Johnson $74.33 New Brunswick NJ
NM Presbyterian Healthcare Services $4.60 Presbyterian Healthcare Services $2.05 Albuquerque NM
NY Verizon Communications $120.55 Verizon Communications $127.07 New York NY
NC Bank of America $101.69 Bank of America $95.18 Charlotte NC
ND MDU Resources Group Inc. $4.46 MDU Resources Group Inc. $4.67 Bismarck ND
OH Cardinal Health $101.09 The Kroger Co. $108.46 Cincinnati OH
OK Love’s Travel Stops & Country Stores Inc. $26.09 Love’s Travel Stops & Country Stores Inc. $26.09 Oklahoma City OK
OR Nike Inc. $25.31 Nike Inc. $27.79 Beaverton OR
PA AmeriSourceBergen $87.95 AmeriSourceBergen $119.56 Chesterbrook PA
RI CVS Caremark $126.76 CVS Caremark $139.36 Woonsocket RI
SC Sonoco Products Company $4.48 Sonoco Products Company $5.01 Hartsville SC
SD Sanford Health $3.10 Poet LLC. $6.00 Sioux Falls SD
TN FedEx Corporation $44.28 FedEx Corporation $45.46 Memphis TN
TX Exxon Mobil $438.25 Exxon Mobil $411.93 Irving TX
UT Huntsman Corporation $11.07 Huntsman Corporation $11.57 Salt Lake City UT
VT Keurig Green Mountain Inc. $4.35 Keurig Green Mountain Inc. $4.70 Waterbury VT
VA Freddie Mac $81.22 The Long & Foster Companies Inc. $42.70 Chantilly VA
WA CostCo Wholesale $105.15 CostCo Wholesale $112.64 Issaquah WA
WV West Virginia University Hospitals Inc. $1.38 Mylan Pharmaceuticals Inc. $1.24 Morgantown WV
WI Johnson Controls Inc. $42.73 Johnson Controls Inc. $42.82 Milwaukee WI
WY Cloud Peak Energy Inc. $1.39 Cloud Peak Energy Inc. $1.39 Gillette WY


Google parent company Alphabet [stckqut]GOOGL[/stckqut] has taken away Apple’s title as the most valuable company in the world by reaching a market value of about $544 billion in after-hours trading today.

Alphabet closed Monday at around $518 billion, but its after-hours stock spike means that it’s bigger — for now. We’ll see if it maintains that at tomorrow’s open.

Apple [stckqut]AAPL[/stckqut] passed Exxon Mobil [stckqut]XOM[/stckqut] in 2011 to become the most valuable public company in the world, worth around $350 billion, before falling to about $538 billion at today’s close.

The changing of the guard here has less to do with an ascendant Alphabet and more to do with Apple’s iPhone sales, which are beginning to slow down. When Cupertino released its earnings report last week, it posted its slowest growth in phone sales since Apple introduced the iPhone in 2007.

Source: Google Surpasses Apple as the Most Valuable Company in the World | Re/code

I recently came across this list on Forbes on the largest 25 tax payers. Forbes does a bit of analysis on each of them. It is probably worth your time to jump over, but I thought I would give the highlights here:


Rank of tax expense

Company

Symbol

Effective Tax Rate

1 ExxonMobil XOM 39%
2 Chevron Corporation CVX 43%
3 Apple Inc. AAPL 25%
4 Wells Fargo & Co. WFC 31.2%
5 JP Morgan Chase & Co. JPM 26%
6 Wal-Mart Stores WMT 31%
7 ConocoPhillips COP 51.5%
8 Berkshire Hathaway Inc. BRK 28%
9 IBM IBM 24%
10 Microsoft Corporation MSFT 22.8%
11 Philip Morris International Inc. PM 29.5%
12 Goldman Sachs GS 33%
14 Comcast Corporation CMCS 32%
14 The Procter & Gamble Co. PG 23.5%
15 Johnson & Johnson JNJ 23.7%
16 Intel Corporation INTC 23.6%
17 Occidental Petroleum Corp. OXY 42%
18 UnitedHealth Group UHG 35.9%
19 The Walt Disney Company DIS 32.7%
20 AT&T T 27.8%
21 Oracle ORCL 21.4%
22 The Coca-Cola Company KO 23.1%
23 The Home Depot Inc. HD 37.2%
24 McDonald’s MCD 32.4%
25 Google GOOG 19.4%

CNET recently put out an article discussing the most profitable US corporations. The article shows that even with Apple’s disappointing quarter that caused a major drop in stock price, Apple is still had more income than anyone else. The issue is that the analysts thought that the results were going to be even better, so the analysts were disappointed. When you disappoint analysts, they punish you by saying bad things. I am borrowing the great CNET chart below.


Apples disappointing quarter in context chart


To this analysis, I would like show how cheap these stocks really are. While I try to not compare the P/E ratio of non-competitors, I think it is valid for this one exercise.

If we look at the P/E and EPS of these companies, it is quite telling how cheap Apple really is among this peer group.


Company

Symbol

P/E

EPS

Apple Inc.

AAPL

9.78

44.10

Exxon Mobil Corporation

XOM

9.17

9.69

Microsoft Corporation

MSFT

15.39

1.82

Pfizer Inc.

PFE

22.36

1.26

International Business Machines Corp.

IBM

14.57

14.41

JPMorgan Chase & Co.

JPM

9.64

5.20

Wells Fargo & Co

WFC

10.85

3.36

The Procter & Gamble Company

PG

19.76

3.90

General Electric Company

GE

17.08

1.39


It might not be obvious from looking at the above table of values. Looking at P/E as a chart shows that Apple is one of the cheapest stocks by comparing its price to the earnings of the company.

Apple's PE compared to the most profitable companies


It really becomes obvious then by looking at the earnings per share in chart format!

Apple's EPS compared to the most profitable companies


So if you think that Apple’s days are done, you may want to think again! In fact, the biggest complaint that you can say about Apple is it seems that they are not getting enough shareholder value! 

If you think that IBM is fairly priced for its earnings then it would be realistic that Apple could increase its share price by 50% if you focus on P/E! By looking at Microsoft, you could say that the price could go up 60%! This means that it is likely that Apple has more upside potential than downside risk.

My disclaimer on this site consistently says that I ‘might’ be long any stock I talk about. In this case, I am long on Apple as I write this article. However, as I consistently point out in my book, The Confident Investor, I didn’t pay for those shares! My current Apple holdings are all free.  If you want to know how to get free stock in great companies, I suggest that you read my book. You can purchase my book wherever books are sold such as Amazon, Barnes and Noble, and Books A Million. It is available in e-book formats for Nook, Kindle, and iPad.