Company name SanDisk Corporation
Stock ticker SNDK
Live stock price [stckqut]SNDK[/stckqut]
P/E compared to competitors Fair

MANAGEMENT EXECUTION

Employee productivity Fair
Sales growth Poor
EPS growth Poor
P/E growth Good
EBIT growth Poor

ANALYSIS

Confident Investor Rating Poor
Target stock price (TWCA growth scenario) $20.62
Target stock price (averages with growth) $13.46
Target stock price (averages with no growth) $10.48
Target stock price (manual assumptions) $34.33

The following company description is from Google Finance: http://www.google.com/finance?q=sndk

SanDisk Corporation provides flash storage solutions. The Company designs, develops and manufactures data storage solutions in a variety of form factors using flash memory, controller, firmware and software technologies. The Company’s solutions include a range of solid state drives (SSD), embedded products, removable cards, universal serial bus (USB), drives, wireless media drives, digital media players, and wafers and components. The SSD products are used in enterprise data centers and client computing platforms. Its embedded flash products are used in mobile phones, tablets, computing platforms, imaging devices and automobiles. The Company’s removable cards are used in a range of applications, such as mobile phones, tablets, digital cameras, gaming devices, personal computers (PC) and automobiles. It also offers software solutions, which are used in conjunction with flash storage products.


Confident Investor comments: At this price and at this time, I do not think that a Confident Investor can confidently invest in SanDisk Corporation. I am removing the stock from my Watch List.

If you would like to understand how to evaluate companies like I do on this site, please read my book, The Confident Investor. You can review the best companies that I have found (and I probably invest my own money in most of these companies) in my Watch List.

How was this analysis of SanDisk Corporation calculated?

For owners of my book, “The Confident Investor” I offer the following analysis (you must be logged in to this site as a book owner in order to see the following analysis). If you have registered and cannot see the balance of this article, make sure you are logged in and refresh your browser.
[s2If current_user_can(access_s2member_level1)]

In order to assist you in using the techniques of this book, the values that I used when calculating the Manual pricing above were:

  • Stock price at the time of the calculation: $48.75
  • Growth: 0.03
  • Current EPS (TTM): $2.51
  • P/E: 19
  • Future EPS Calc: $2.9
  • Future Stock Price Calc: $55.28
  • Target stock price: $34.32

[/s2If]
I hope that this makes you a Confident Investor.
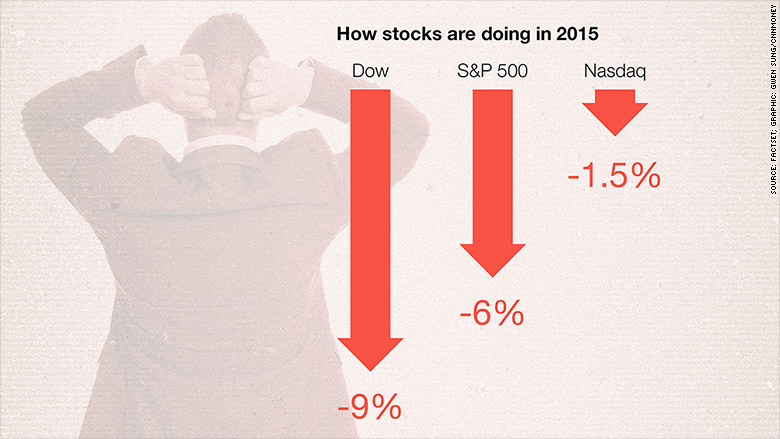
No wonder the past few days have been alarming for many. On Monday, the Dow fell 1,000 points in the morning — its largest point swing ever.

But most Americans aren’t day traders. They are in the stock market for the right reason — because they want to grow their money over many years or decades.

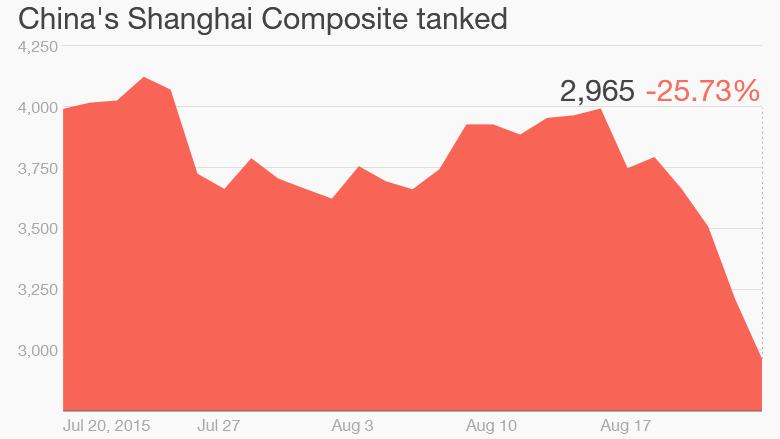
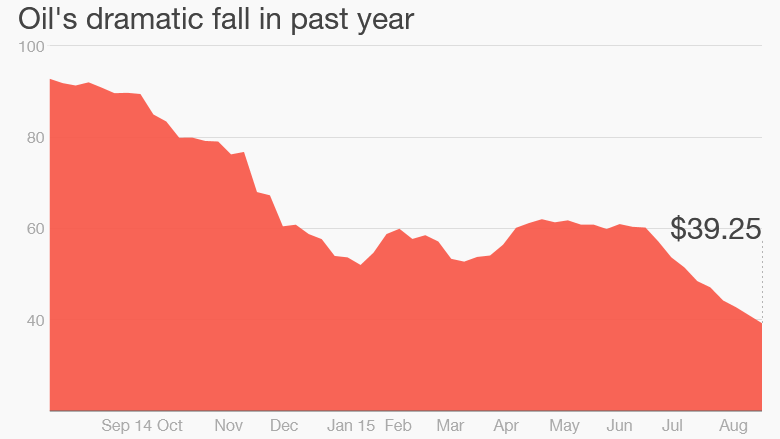
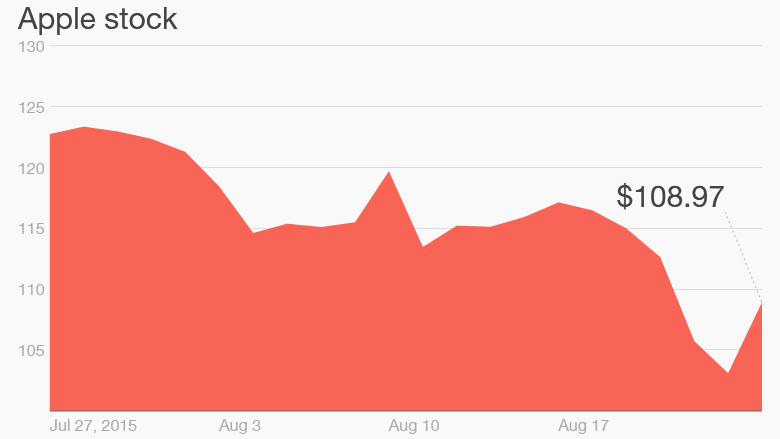
The smartest move in the past few days was to not panic and dump stocks. Here are 5 simple charts to get some perspective on where investors are at after these wild swings.

If you want to understand more about these topics, go to the link at the bottom of this article for the CNN Money original article.

1. Your stocks are losing money in 2015

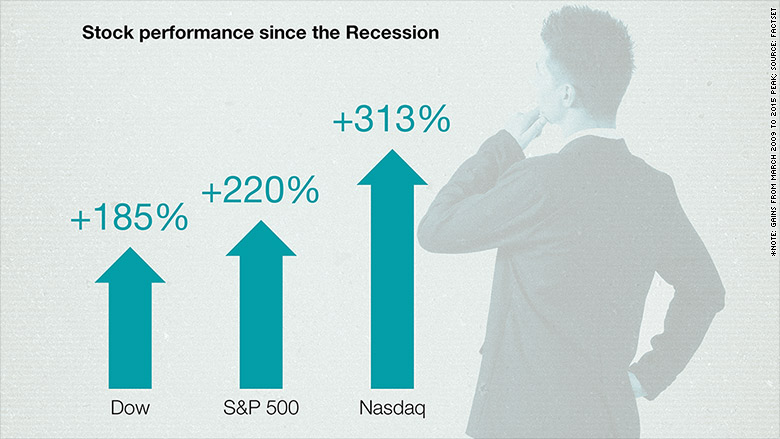
2. But you made a lot of money the past 6 years

3. China is the heart of this problem

4. Oil is so cheap that some companies are hurting

5. America’s favorite stocks like Apple are down. Maybe too much?

Source: Relax. Stocks are still up nearly 200% since 2009 – Aug. 25, 2015

Company name Boston Beer Co Inc
Stock ticker SAM
Live stock price [stckqut]SAM[/stckqut]
P/E compared to competitors Good

MANAGEMENT EXECUTION

Employee productivity Good
Sales growth Good
EPS growth Good
P/E growth Poor
EBIT growth Good

ANALYSIS

Confident Investor Rating Good
Target stock price (TWCA growth scenario) $189.05
Target stock price (averages with growth) $167.2
Target stock price (averages with no growth) $94.19
Target stock price (manual assumptions) $201.47

The following company description is from Google Finance: http://www.google.com/finance?q=sam

The Boston Beer Company, Inc. (Boston Beer) is a craft brewer in the United States. The Company is engaged in the business of producing and selling alcohol beverages primarily in the domestic market and in international markets. As of December 31, 2014, Boston Beer sold approximately 4.1 million barrels of its products. As of December 31, 2014, the Company sold over sixty beers under the Samuel Adams or the Sam Adams brand names, eleven flavored malt beverages under the Twisted Tea brand name, ten hard cider beverages under the Angry Orchard brand name, and over twenty beers under four of the brand names of its subsidiary, Alchemy & Science. Boston Beer produces malt beverages and hard cider at the Company-owned breweries and under contract arrangements at other brewery locations.


Confident Investor comments: At this price and at this time, I think that a Confident Investor can confidently invest in Boston Beer Co Inc.

If you would like to understand how to evaluate companies like I do on this site, please read my book, The Confident Investor. You can review the best companies that I have found (and I probably invest my own money in most of these companies) in my Watch List.

How was this analysis of Boston Beer Co Inc calculated?

For owners of my book, “The Confident Investor” I offer the following analysis (you must be logged in to this site as a book owner in order to see the following analysis). If you have registered and cannot see the balance of this article, make sure you are logged in and refresh your browser.
[s2If current_user_can(access_s2member_level1)]

In order to assist you in using the techniques of this book, the values that I used when calculating the Manual pricing above were:

  • Stock price at the time of the calculation: $201.71
  • Growth: 0.1
  • Current EPS (TTM): $7.38
  • P/E: 27.3
  • Future EPS Calc: $11.88
  • Future Stock Price Calc: $324.47
  • Target stock price: $201.47

[/s2If]
I hope that this makes you a Confident Investor.
A stunning slide in some of Wall Street’s biggest exchange-traded funds has market watchers speculating that computer-driven trading was the cause.

“It was entirely — in my opinion — algorithmic trading that was ruling the day, and market makers stepped away,” said Dave Nadig, FactSet’s director of exchange-traded funds. And while many have described the dramatic action as a “flash crash,” Nadig said it is “a little hard to call it a flash crash when it lasted 45 minutes.”

These brief dives could have been sparked by preprogrammed trading strategies that went to cash — and sold these ETFs way below their fair value — because the broad market was down by a certain percentage, Nadig told MarketWatch. “If you implement that poorly, you can end up just being a seller at any price,” he said.

Source: Here’s what may have caused the ‘flash crash’ in some big ETFs – MarketWatch