I recently came across this list on Forbes on the largest 25 tax payers. Forbes does a bit of analysis on each of them. It is probably worth your time to jump over, but I thought I would give the highlights here:


Rank of tax expense

Company

Symbol

Effective Tax Rate

1 ExxonMobil XOM 39%
2 Chevron Corporation CVX 43%
3 Apple Inc. AAPL 25%
4 Wells Fargo & Co. WFC 31.2%
5 JP Morgan Chase & Co. JPM 26%
6 Wal-Mart Stores WMT 31%
7 ConocoPhillips COP 51.5%
8 Berkshire Hathaway Inc. BRK 28%
9 IBM IBM 24%
10 Microsoft Corporation MSFT 22.8%
11 Philip Morris International Inc. PM 29.5%
12 Goldman Sachs GS 33%
14 Comcast Corporation CMCS 32%
14 The Procter & Gamble Co. PG 23.5%
15 Johnson & Johnson JNJ 23.7%
16 Intel Corporation INTC 23.6%
17 Occidental Petroleum Corp. OXY 42%
18 UnitedHealth Group UHG 35.9%
19 The Walt Disney Company DIS 32.7%
20 AT&T T 27.8%
21 Oracle ORCL 21.4%
22 The Coca-Cola Company KO 23.1%
23 The Home Depot Inc. HD 37.2%
24 McDonald’s MCD 32.4%
25 Google GOOG 19.4%

While you are enjoying the beginning of summer with a 3-day weekend. Please do not forget why you are not working today.

Remember those who served. All gave some and some gave all they had.

CNET recently put out an article discussing the most profitable US corporations. The article shows that even with Apple’s disappointing quarter that caused a major drop in stock price, Apple is still had more income than anyone else. The issue is that the analysts thought that the results were going to be even better, so the analysts were disappointed. When you disappoint analysts, they punish you by saying bad things. I am borrowing the great CNET chart below.


Apples disappointing quarter in context chart


To this analysis, I would like show how cheap these stocks really are. While I try to not compare the P/E ratio of non-competitors, I think it is valid for this one exercise.

If we look at the P/E and EPS of these companies, it is quite telling how cheap Apple really is among this peer group.


Company

Symbol

P/E

EPS

Apple Inc.

AAPL

9.78

44.10

Exxon Mobil Corporation

XOM

9.17

9.69

Microsoft Corporation

MSFT

15.39

1.82

Pfizer Inc.

PFE

22.36

1.26

International Business Machines Corp.

IBM

14.57

14.41

JPMorgan Chase & Co.

JPM

9.64

5.20

Wells Fargo & Co

WFC

10.85

3.36

The Procter & Gamble Company

PG

19.76

3.90

General Electric Company

GE

17.08

1.39


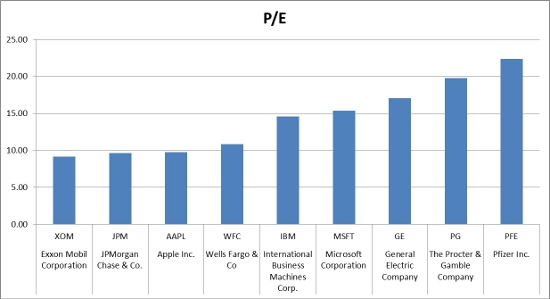
It might not be obvious from looking at the above table of values. Looking at P/E as a chart shows that Apple is one of the cheapest stocks by comparing its price to the earnings of the company.

Apple's PE compared to the most profitable companies


It really becomes obvious then by looking at the earnings per share in chart format!

Apple's EPS compared to the most profitable companies


So if you think that Apple’s days are done, you may want to think again! In fact, the biggest complaint that you can say about Apple is it seems that they are not getting enough shareholder value! 

If you think that IBM is fairly priced for its earnings then it would be realistic that Apple could increase its share price by 50% if you focus on P/E! By looking at Microsoft, you could say that the price could go up 60%! This means that it is likely that Apple has more upside potential than downside risk.

My disclaimer on this site consistently says that I ‘might’ be long any stock I talk about. In this case, I am long on Apple as I write this article. However, as I consistently point out in my book, The Confident Investor, I didn’t pay for those shares! My current Apple holdings are all free.  If you want to know how to get free stock in great companies, I suggest that you read my book. You can purchase my book wherever books are sold such as Amazon, Barnes and Noble, and Books A Million. It is available in e-book formats for Nook, Kindle, and iPad.

To be honest, I never considered this approach before.

I typically do not like paying fees to fund managers. I am especially skeptical of standard mutual funds when their track record can be worse than the market almost as frequently as above the market.  According to that great champion of individual investors, Motley Fool:

The average actively managed stock mutual fund returns approximately 2% less per year to its shareholders than the stock market returns in general.

Most of my advice is to pick great companies and invest in them with caution, taking profits when the market moves against the company’s stock. I do suggest that a certain portion of your portfolio reside in index funds – I typically tell people to pick their favorite broker and buy a DOW index fund, a S&P index fund, and at least one international index fund.  I rarely care about the brand since we are just trying to match whatever the market is doing.

Crossing Wall Street just did a great post describing a fairly mathematically correct method of creating your own S&P Index fund.  This would allow you to avoid any fees leveraged by the index fund management company.  Not a bad idea.  Note though that not all of these companies are Good Companies (in fact at least one of them is a Poor Company) but that is okay since you are only investing in these companies because they are your own home-grown index fund.

Looking to build a quick-and-easy index fund? Of all the stocks in the Dow, United Technologies [stckqut]UTX[/stckqut] has had the strongest daily correlation with the S&P 500 going back to the beginning of 2005. Each day’s UTX gain or loss has a 69.7% correlation with the S&P 500.

If add in Dupont [stckqut]DD[/stckqut], the correlation jumps to 80.5%. (Note this is average daily change, so it assumes you invest equal amounts each day.)

If you add is Disney [stckqut]DIS[/stckqut], the correlation rises to 85.4%.

Now the extra correlation really is hard to come by. If you add ExxonMobil [stckqut]XOM[/stckqut], the correlation rises to 88.9%.

Still more?

If we add American Express [stckqut]AXP[/stckqut] the daily correlations rises to 90.6%.

Verizon [stckqut]VZ[/stckqut] brings it up to 92.6%.

If you want to go for seven stocks, IBM [stckqut]IBM[/stckqut] will bring you up to 94%.

Now we’re almost out of room. Wal-Mart [stckqut]WMT[/stckqut] will bring our eight stock index fund up to a 95% daily correlation with the S&P 500. This is, of course, an equally weighted fund.

Obviously, you will spend $15-$20 per stock as you buy and eventually sell each stock (I assume you know where to buy or sell a stock for $7-$10). this may make this strategy not work for you depending on the amount that you invest in your “fund” so do the math before you get online with your favorite broker.

In the past, I have rated XTO Energy (NYSE:XTO) as a Good company. It is no surprise that Exxon Mobile (NYSE:XOM) has agreed to buy the company. XTO management has traditionally done a great job of running the company. Actually, I think XTO could have done better since my analysis back on October 20 showed that the company was worth at least $57 a share and could have broken $100 if their revenue and profitability would have continued to grow at their traditional rate.

Since this appears to be a friendly merger, it is not likely that XTO Energy will continue as an independent concern. While I will leave the posting from the past in place, I will no longer list XTO on the Watch List.