The way a financial adviser charges for advice often makes no sense, and it needs to change.

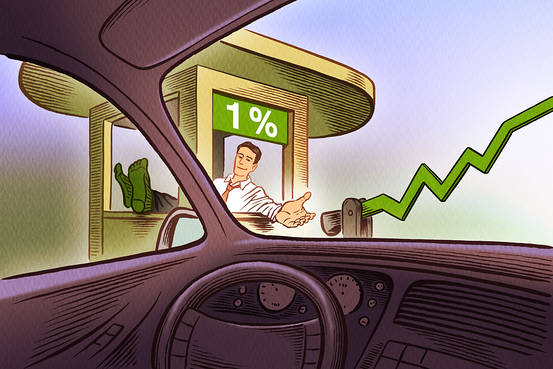
The typical adviser charges absurdly high fees to manage your money, often with mediocre results—but next to nothing to provide financial-planning expertise, which can be hugely valuable.

According to survey data gathered from more than 7,000 advisers by Cerulli Associates, a financial-research firm in Boston, 79% of advisers’ compensation comes from asset-based fees—which may bear little relationship to the services the clients use.

Such charges, typically based on the size of a client’s investment portfolio, vary widely. You might pay as little as 0.25% annually or up to 2% or more. Advisers and analysts estimate that the typical investor likely pays a pinch less than 1%.

But these fees look increasingly bizarre nowadays: For less than 0.1% annually, you can build your own portfolio of exchange-traded funds covering every worthwhile investment in the world. And online “robo adviser” services will manage ETF portfolios for you for 0.25% or less.

Of course, many people require advice that extends well beyond baskets of stocks, bonds or funds: saving for college, managing debt, minimizing income and estate taxes, giving to charity, financing retirement.

That sort of advice can be priceless—yet, oddly, many financial advisers don’t charge separately for it. You pay indirectly, out of the fees you are charged for portfolio management.

This clip of the article on financial adviser fees has been very lightly edited and was originally found at: Why You’re Paying Too Much in Fees – MoneyBeat – WSJ

Apple Inc. [stckqut]AAPL[/stckqut] has fallen victim to the “Curse of the Dow.”

Friday marks the three-month anniversary of Apple’s inclusion in the Dow Jones Industrial Average. It hasn’t exactly been a stellar three months for Apple’s stock.

The old Wall Street adage about the supposed “curse” goes as follows: Companies typically rally in the months leading up to their addition to the Dow 30, but underperform in the months that follow.

Since 1999, the 16 firms joining the Dow (Apple excluded) have seen their stocks increase an average 1% in the six months after their induction, according to data gathered by Birinyi Associates. That’s compared to gains of 11%, on average, for the companies in the six months preceding their inclusion.

Apple hasn’t reached the six-month mark yet. But three months later, its shares are down 0.5% after rising 13% in the three months leading up to their addition. The stock’s sideways action the past three months isn’t that different than the performance of the broader market. The Dow has risen 0.2% since mid-March, only slightly outperforming Apple.

“The ‘Curse of the Dow’ is alive and well,” said Nick Colas, chief market strategist at Convergex, referring to Apple’s performance.

You can read the rest of the article at the original source: Apple Plagued by the Curse of the Dow – MoneyBeat – WSJ

Company name Lululemon Athletica inc.
Stock ticker LULU
Live stock price [stckqut]LULU[/stckqut]
P/E compared to competitors Fair

MANAGEMENT EXECUTION

Employee productivity Poor
Sales growth Good
EPS growth Good
P/E growth Poor
EBIT growth Good

ANALYSIS

Confident Investor Rating Fair
Target stock price (TWCA growth scenario) $96.53
Target stock price (averages with growth) $99.86
Target stock price (averages with no growth) $46.54
Target stock price (manual assumptions) $90.63

The following company description is from Google Finance: http://www.google.com/finance?q=lulu

lululemon athletica inc. is a designer and retailer of technical athletic apparel. The Company offers a line of apparel and accessories for women, men and female youth. Its apparel assortment includes items, such as pants, shorts, tops and jackets designed for healthy lifestyle activities and athletic pursuits, such as yoga, running, general fitness and dance-inspired apparel for female youth. The Company conducts its business through two channels: corporate-owned stores and direct to consumer. The Company markets its athletic apparel under the lululemon athletica and ivivva athletica brand names. As of February 1, 2015, the Company’s retail footprint included 211 stores in the United States, 57 stores in Canada, 26 stores in Australia, five in New Zealand, two in the United Kingdom and one in Singapore. The Company’s retail stores are located primarily on street locations, in lifestyle centers and in malls.


Confident Investor comments: At this time, I think that a Confident Investor can cautiously invest in Lululemon Athletica inc. as long as the price is correct. Most of the fundamentals of this company are good but there are some concerns.

If you would like to understand how to evaluate companies like I do on this site, please read my book, The Confident Investor. You can review the best companies that I have found (and I probably invest my own money in most of these companies) in my Watch List.

How was this analysis of Lululemon Athletica inc. calculated?

For owners of my book, “The Confident Investor” I offer the following analysis (you must be logged in to this site as a book owner in order to see the following analysis). If you have registered and cannot see the balance of this article, make sure you are logged in and refresh your browser.
[s2If current_user_can(access_s2member_level1)]

In order to assist you in using the techniques of this book, the values that I used when calculating the Manual pricing above were:

  • Stock price at the time of the calculation: $66.51
  • Growth: 0.17
  • Current EPS (TTM): $1.87
  • P/E: 35.6
  • Future EPS Calc: $4.09
  • Future Stock Price Calc: $145.95
  • Target stock price: $90.62

[/s2If]
I hope that this makes you a Confident Investor.

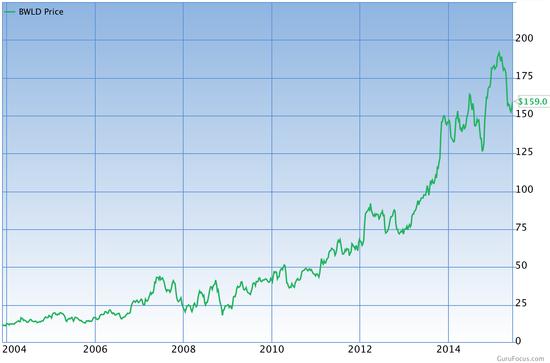
In the first quarter, Buffalo Wild Wings [stckqut]BWLD[/stckqut] reported a 19.8% increase in sales. Both new store and existing stores sales were quite strong. Same-store-sales at company-owned restaurants were up 7% while franchised restaurants grew by 6%.

While sales were up nearly 20% however, earnings were only up 2.6%. Operating margins were down by 170 basis points to 9.9%. Labor costs rose by 100 basis points to 29.6% of total sales. Cost of sales meanwhile rose by 200 basis points points to 28.5% sales, driven by a 40% increase in chicken wing prices following strong demand. Wing prices for the company were $1.92/lb versus $1.36/lb a year ago.

However, there is reason to believe that margins will return. Management reaffirmed its EPS growth guidance for the year of 18%. One could argue that management had already accounted for the impact of chicken prices given their previous estimates typically targeted around 24% growth.

Additionally, BWLD struggled to manage its labor costs as they staffed all locations with Guest Experience Captains. If this proves to improve sales enough to warrant the cost, the company can reasonably expect to keep it. If it is still a cost drag, it wouldn’t be too difficult to scale back down to historical levels.

… and later in the article…

While margin pressures are a primary factory to the current weak share price, these headwinds look temporary, or at least fixable. Now trading at a valuation not seen for some time, investors would be wise to consider BWLD for their portfolio.

Source: Buffalo Wild Wings Still a Great Value – GuruFocus.com