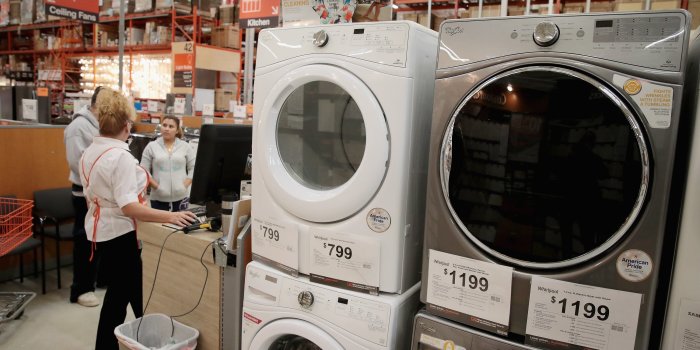
Americans are saving less as the economy and stock market heat up and they boost their spending on big-ticket items like cars and refrigerators.

The U.S. saving rate fell to a 10-year low of 3.1% in September, down from a recent peak of 6.3% in October 2015, the Commerce Department said Monday.

Low unemployment and rising stock prices are likely contributing to household optimism, making people willing to save less and spend more in anticipation of continued job and wealth gains.

The saving rate has now sat below 4% for seven straight months. It likewise hovered at low rates in the late 1990s, when stock prices soared and the jobless rate fell below 5%, and again in the mid-2000s, when home prices soared and the unemployment rate again dropped.

It is ill-advised for people to decrease their savings. In the 21st century, the advances in medical care mean that we will likely live longer than our parents and our grandparents. This means that Americans will need a strong savings account to draw upon in retirement to maintain their standard of living. It also means they need to actively invest and earn higher than 10% returns on that investment.

Source: Americans Are Spending More, Saving Less

Company name Facebook Inc
Stock ticker FB
Live stock price [stckqut]FB[/stckqut]
P/E compared to competitors Fair

MANAGEMENT EXECUTION

Employee productivity Good
Sales growth Good
EPS growth Good
P/E growth Poor
EBIT growth Good

ANALYSIS

Confident Investor Rating Good
Target stock price (TWCA growth scenario) $261.62
Target stock price (averages with growth) $288.28
Target stock price (averages with no growth) $129.85
Target stock price (manual assumptions) $262.97

The following company description is from Google Finance: http://www.google.com/finance?q=fb

Facebook, Inc. is focused on building products that enable people to connect and share through mobile devices, personal computers and other surfaces. The Company’s products include Facebook, Instagram, Messenger, WhatsApp and Oculus. Facebook enables people to connect, share, discover and communicate with each other on mobile devices and personal computers. Instagram enables people to take photos or videos, customize them with filter effects, and share them with friends and followers in a photo feed or send them directly to friends. Messenger allows communicating with people and businesses alike across a range of platforms and devices. WhatsApp Messenger is a messaging application that is used by people around the world and is available on a range of mobile platforms. Its Oculus virtual reality technology and content platform offers products that allow people to enter an interactive environment to play games, consume content and connect with others.


Confident Investor comments: At this price and at this time, I think that a Confident Investor can confidently invest in Facebook Inc.

If you would like to understand how to evaluate companies like I do on this site, please read my book, The Confident Investor. You can review the best companies that I have found (and I probably invest my own money in most of these companies) in my Watch List.

How was this analysis of Facebook Inc calculated?

For owners of my book, “The Confident Investor” I offer the following analysis (you must be logged in to this site as a book owner in order to see the following analysis). If you have registered and cannot see the balance of this article, make sure you are logged in and refresh your browser.
[s2If current_user_can(access_s2member_level1)]

In order to assist you in using the techniques of this book, the values that I used when calculating the Manual pricing above were:

  • Stock price at the time of the calculation: $169.47
  • Growth: 0.2
  • Current EPS (TTM): $4.6
  • P/E: 37
  • Future EPS Calc: $11.44
  • Future Stock Price Calc: $423.51
  • Target stock price: $262.96

[/s2If]
I hope that this makes you a Confident Investor.


One of the biggest challenges in investing in the stock market is picking the best stocks. In my book, “The Confident Investor” I teach my readers how to pick Good Companies. This page is designed to show the raw performance of these companies. It is not designed to show my personal portfolio, which may or may not exceed the performance stated here. Since I use the trading system described in my book, you can assume that I beat the performance recorded here.

I must caution you, I do not actually propose that you “buy and hold” any given stock, but rather you should “buy to hold” the stock. My investing technique teaches you to efficiently move your money to the stocks that are currently increasing in value the most. I use my Watch List for this work, these are Good Companies that I wait for great buying opportunities. This strategy is well described in my book, “The Confident Investor” and tends to be a very safe strategy in bear markets while typically still providing above market returns in a bull or flat market.

My Short Term Watch List are 15 companies that are hot right now. I select this list every quarter. I evenly divide a portion of my portfolio among these 15 companies. The next quarter, I add or delete companies as necessary and then re-balance the portfolio. This tends to be a more risky strategy because I don’t bail out on bad stock movement (at least until the end of the quarter). In a bull market or a flat market, these very well-run and high-performing companies tend to beat the general market by a significant margin.

BL-TCI-cover
You can purchase my book wherever books are sold such as Amazon, Barnes and Noble, and Books A Million. It is available in paperback as well as e-book formats for Nook, Kindle, and iPad.

WATCH LIST STOCK RESULTS


Stock
Ticker
Company
name
Current
price
Year
ago
Year ago
change
Month
ago
Month ago
change
Week
ago
Week ago
change
AAPL Apple Inc. $163.05 $111.74 45.92% $154.12 5.79% $156.17 4.41%
ABMD ABIOMED, Inc. $181.07 $105.13 72.23% $168.60 7.40% $176.00 2.88%
ADS Alliance Data Systems Corporation $231.83 $201.95 14.80% $221.55 4.64% $239.33 -3.13%
ALGN Align Technology, Inc. $235.94 $85.17 177.02% $186.27 26.67% $202.76 16.36%
ALXN Alexion Pharmaceuticals, Inc. $128.62 $135.59 -5.14% $140.29 -8.32% $135.20 -4.87%
AMAT Applied Materials, Inc. $56.69 $28.36 99.87% $52.09 8.83% $56.37 0.57%
AMZN Amazon $1,100.95 $776.32 41.82% $961.35 14.52% $966.30 13.93%
AYI Acuity Brands, Inc. $158.69 $222.48 -28.67% $171.14 -7.28% $159.95 -0.79%
BABA Alibaba Group Holding Ltd $176.15 $101.93 72.81% $172.71 1.99% $173.13 1.74%
BWLD Buffalo Wild Wings $124.50 $143.20 -13.06% $105.70 17.79% $106.05 17.40%
CBPO China Biologic Products Inc $80.40 $120.00 -33.00% $92.27 -12.86% $81.22 -1.01%
COF Capital One Financial Corp. $92.78 $73.19 26.76% $84.66 9.59% $89.72 3.41%
CRUS Cirrus Logic, Inc. $57.02 $55.34 3.04% $53.32 6.94% $53.32 6.94%
CVCO Cavco Industries, Inc. $155.25 $91.70 69.30% $147.55 5.22% $154.00 0.81%
DPZ Domino’s Pizza, Inc. $184.68 $166.34 11.02% $198.55 -6.99% $182.63 1.12%
EW Edwards Lifesciences Corp $101.92 $96.16 5.99% $109.31 -6.76% $114.11 -10.68%
EXR Extra Space Storage, Inc. $80.30 $69.16 16.11% $79.92 0.48% $81.87 -1.92%
FB Facebook Inc $177.88 $131.29 35.49% $170.87 4.10% $171.27 3.86%
GOOGL Alphabet Inc $1,033.67 $819.56 26.12% $973.72 6.16% $985.54 4.88%
GTN Gray Television, Inc. $15.40 $9.10 69.23% $15.70 -1.91% $15.35 0.33%
GWR Genesee & Wyoming Inc $73.62 $66.07 11.43% $74.01 -0.53% $72.76 1.18%
HDSN Hudson Technologies, Inc. $5.87 $6.04 -2.81% $7.81 -24.84% $5.83 0.69%
HOG Harley-Davidson Inc $47.84 $54.59 -12.37% $48.21 -0.77% $48.51 -1.38%
HSKA Heska Corp $97.70 $48.09 103.16% $88.09 10.91% $96.35 1.40%
HZO MarineMax Inc $15.85 $19.30 -17.88% $16.55 -4.23% $16.75 -5.37%
IDXX IDEXX Laboratories, Inc. $168.37 $105.05 60.28% $155.49 8.28% $164.43 2.40%
LNCE Snyder’s-Lance Inc $38.00 $35.12 8.21% $38.14 -0.37% $37.99 0.03%
LULU Lululemon Athletica inc. $62.40 $58.40 6.85% $62.25 0.24% $63.83 -2.24%
MCK McKesson Corporation $135.62 $123.14 10.13% $153.61 -11.71% $148.30 -8.55%
MEI Methode Electronics Inc. $46.75 $30.14 55.10% $42.26 10.61% $46.05 1.52%
MET Metlife Inc $54.29 $40.62 33.65% $51.95 4.50% $53.44 1.59%
MIDD Middleby Corp $117.11 $109.97 6.49% $128.17 -8.63% $117.05 0.05%
MNST Monster Beverage Corporation $56.75 $47.97 18.29% $55.25 2.71% $56.36 0.69%
MRK Merck & Co., Inc. $58.24 $57.14 1.93% $64.03 -9.04% $63.40 -8.14%
NFLX Netflix, Inc. $199.54 $126.57 57.65% $181.35 10.03% $192.47 3.67%
NVDA NVIDIA Corporation $201.86 $70.23 187.41% $178.77 12.92% $196.62 2.67%
PCLN Priceline Group Inc $1,890.92 $1,474.82 28.21% $1,830.82 3.28% $1,934.55 -2.26%
REGN Regeneron Pharmaceuticals Inc $409.22 $355.83 15.00% $447.12 -8.48% $432.76 -5.44%
SAM Boston Beer Company Inc $167.25 $157.60 6.12% $156.20 7.07% $175.55 -4.73%
SBUX Starbucks Corporation $54.88 $52.59 4.36% $53.71 2.18% $54.27 1.12%
STZ Constellation Brands, Inc. $211.90 $164.26 29.01% $199.45 6.24% $211.71 0.09%
SUI Sun Communities Inc $90.07 $73.35 22.79% $85.68 5.12% $88.78 1.45%
SWKS Skyworks Solutions Inc $107.91 $74.77 44.31% $101.90 5.90% $104.77 3.00%
THRM Gentherm Inc $33.05 $27.95 18.25% $37.15 -11.04% $35.90 -7.94%
TMO Thermo Fisher Scientific Inc. $192.42 $146.68 31.18% $189.20 1.70% $194.37 -1.00%
TRN Trinity Industries Inc $32.08 $20.67 55.22% $31.78 0.95% $34.46 -6.91%
UA Under Armour Inc $14.40 $25.91 -44.42% $15.02 -4.13% $15.22 -5.39%
ULTA Ulta Beauty Inc $198.93 $242.31 -17.90% $226.06 -12.00% $202.36 -1.69%

Over the last year, my Watch List returned 26.64%
Over the last month, my Watch List returned 3.79%
Over the last week, my Watch List returned 1.69%

SHORT TERM WATCH LIST STOCK RESULTS


Stock
Ticker
Company
name
Current
price
Year
ago
Year ago
change
Month
ago
Month ago
change
Week
ago
Week ago
change
AAPL Apple Inc. $163.05 $111.74 45.92% $154.12 5.79% $156.17 4.41%
ABMD ABIOMED, Inc. $181.07 $105.13 72.23% $168.60 7.40% $176.00 2.88%
ALGN Align Technology, Inc. $235.94 $85.17 177.02% $186.27 26.67% $202.76 16.36%
AMAT Applied Materials, Inc. $56.69 $28.36 99.87% $52.09 8.83% $56.37 0.57%
BABA Alibaba Group Holding Ltd $176.15 $101.93 72.81% $172.71 1.99% $173.13 1.74%
CVCO Cavco Industries, Inc. $155.25 $91.70 69.30% $147.55 5.22% $154.00 0.81%
DPZ Domino’s Pizza, Inc. $184.68 $166.34 11.02% $198.55 -6.99% $182.63 1.12%
FB Facebook Inc $177.88 $131.29 35.49% $170.87 4.10% $171.27 3.86%
GTN Gray Television, Inc. $15.40 $9.10 69.23% $15.70 -1.91% $15.35 0.33%
HSKA Heska Corp $97.70 $48.09 103.16% $88.09 10.91% $96.35 1.40%
NFLX Netflix, Inc. $199.54 $126.57 57.65% $181.35 10.03% $192.47 3.67%
NVDA NVIDIA Corporation $201.86 $70.23 187.41% $178.77 12.92% $196.62 2.67%
PCLN Priceline Group Inc $1,890.92 $1,474.82 28.21% $1,830.82 3.28% $1,934.55 -2.26%
STZ Constellation Brands, Inc. $211.90 $164.26 29.01% $199.45 6.24% $211.71 0.09%
TRN Trinity Industries Inc $32.08 $20.67 55.22% $31.78 0.95% $34.46 -6.91%

Over the last year, my Short Term Watch List returned 45.50%
Over the last month, my Short Term Watch List returned 5.39%
Over the last week, my Short Term Watch List returned 0.66%

Short Term List returned 46%
High growth stock: NVIDIA Corporation ($NVDA) at 187%
Total Execution Time: 96.378201961517 Sec

Big Tech can generate big numbers, but it was fast growth in the cloud business that helped ignite a buying frenzy Friday that drove up market values by nearly $139 billion in 30 minutes.

The stunning growth of the cloud businesses at Amazon.com Inc. [stckqut]AMZN[/stckqut] Microsoft Corp. [stckqut]MSFT[/stckqut], and Google parent Alphabet Inc. [stckqut]GOOGL[/stckqut] were a relatively small part of the strong quarterly results the three companies reported Thursday. But fast growth in cloud revenue, along with relatively stable service prices that helped profit margins during the quarter, gave investors reasons to bet the three giants could maintain their growth trajectories.

Shares of the three companies kept rising Friday, with their combined $147 billion market-value gain topping the value of more than 90% of the other companies in the S&P 500, including nearly every other company selling cloud-based software services.

Source: Tech Rally Is Juiced by Highflying Cloud Business – WSJ

The online retail giant gave Wall Street some cheer Thursday, posting third-quarter sales that jumped 34% to $43.7 billion. That would have beat analysts’ forecasts even without a $1.3 billion contribution from Whole Foods Market. Operating income, while down 40% year-over-year to $347 million, managed to beat the company’s rather downbeat forecast from the second quarter, the midpoint of which projected a loss of $50 million.

The key question moving forward is how long Amazon’s [stckqut]AMZN[/stckqut] current “investment mode” may last. Wall Street is betting on a sooner than later. Analysts expect record operating income of $6.5 billion next year compared with a projected $3.3 billion this year. But the company is absorbing the huge acquisition of Whole Foods as well as building on its future ambitions for grocery, devices, cloud and quite possibly other areas—such as pharmacies.

Those don’t come cheap. It is worth noting that Amazon’s free cash flow dipped into negative territory for the third quarter if one includes the payments made to cover its capital lease obligations. And now that Whole Foods is factored in, Amazon now employs more than half a million full-time employees. With investors hungry for more profits, that is a lot of mouths to feed.

Source: Amazon’s Profits Don’t Come Cheap – WSJ