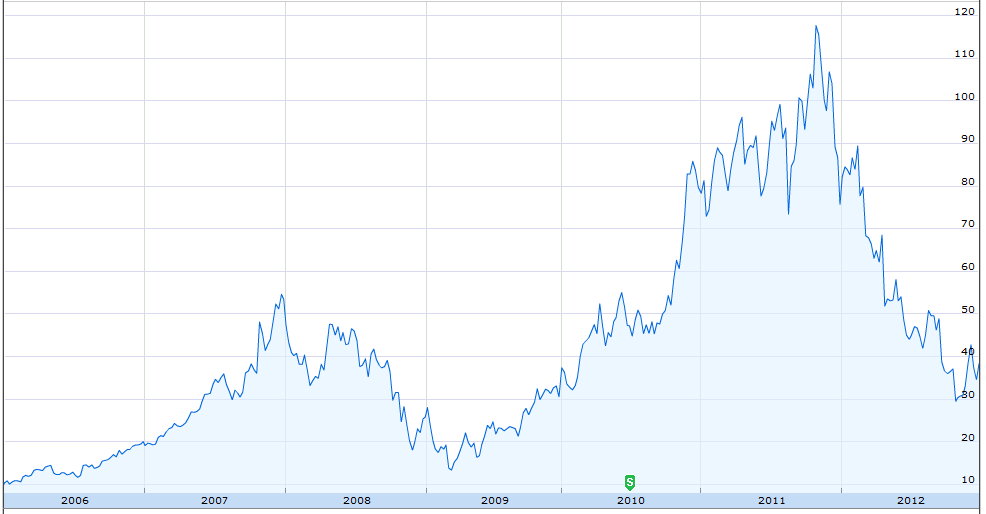
In a 7 year time frame from January 3, 2006 to December 31, 2012, Boston Beer [stckqut]SAM[/stckqut] increased 433.4% if you would have implemented a pure buy-and-hold strategy. If you would implemented the strategy that I explain in my book, The Confident Investor, you would have seen a 550.6% return on your investment. This is a 27.0% increase on the profit percentage.

To put it into actual dollars, suppose you invested $10,000 in SAM on 1/3/2006. With the system that is explained in The Confident Investor, you would have exited the market on 12/31/2012 with $77,006.32. With my system, it is not uncommon for you to need a bit more cash available to cover the ongoing trades. Therefore, rather than $10,000, you would have needed $11,836.98. You would have 502 shares which were purchased with other people’s money and still have your original $10,000.

To be fair in our comparison, the buy-and-hold method if calculated with $11,836.98 would have ended up with $63,136.04 and a respectable 433.4%. You would have purchased 473 shares but your original $11,836.98 would be tied up in the stock.

The profit on the buy-and-hold strategy in this scenario is $51,299.72.  The profit using GOPM (Grow on Other People’s Money) is $65,170.64.  That means the increased profit on SAM in this time frame was $13,870.92. This means your profit INCREASED by 27.0%!!

Understanding buy-and-hold is easy. You have a given amount of money, in this case $11,836.98. You buy 473 shares at the start of the test period. At the end of the test period, you sell the shares and the profit (or loss) is the standard that any other system must beat.

Understanding GOPM is a bit more complicated without reading my book, The Confident Investor. Before you even start to invest, the system teaches you to look for incredibly well-run companies and only invest in those companies. While SAM may or may not have qualified for this status in 2006, it does in 2013 so we are simply back-testing against a currently well-run company. While past performance doesn’t guarantee future performance, it is probably the best tool that we have to understand investment methodologies.

After you find a well-run company, you are going to buy $10,000 worth of shares when the technical indicators tell you that the stock has upward momentum. You are then going to sell those shares when that momentum slows down or reverses.  The profit that you make on that transaction, you will keep in the stock (in other words, you are not going to sell those shares). You are going to keep the $10,000 ready for when the stock has the correct momentum. If there is any excess profit (e.g. less than the value of a full share after keeping the $10,000) you will just stick that into your money-market account in this example. It is possible that you could invest this excess amount but we are going to simplify this example and just hold that money.

As a quick example, you invest $10,000 in a stock trading at $50 per share so you have purchased 200 shares.  Over the course of the next several days or weeks, the stock price increases to $55 which is where you decide to sell. To get your original capital of $10,000 back, you sell 182 shares resulting in $10,010 in your account and 18 shares that are essentially free since they were purchased with Other People’s Money. You now have your original capital of $10,000, 18 free shares and an additional $10.

Using this technique, you will make several trades per year and may even be trading weekly. Therefore, to make this model fair, I need to account for stockbroker fees and commissions.  In this example, I am using $8 for every sell and for every purchase. You may have a better fee from your favorite broker but $8 seems fair for a test. Frankly, if you are paying more than $10 for each transaction then you probably need to be looking at another broker!

Using this technique, by the end of the test on 12/31/2012 you would have 502 shares of SAM that cost you $1,836.32. Those 502 shares were acquired for $3.658 per share! This is significantly cheaper than today’s stock price and no matter what happens to SAM you could probably sell these shares for a profit at any time! You would still have the original $10,000 in your bank account! This is because you have purchased these share with Other People’s Money.  This is why I call my system GOPM – Grow on Other People’s Money.

If you would have invested in Boston Beer as described in this article, you would have doubled your investment by August 14, 2009. By that date, you would have acquired 255 shares of SAM which were valued at about $39.78 for a total profit of $10,142.63. This means your $10,000 initial investment would have doubled.

The rest of this article shows each buy and sell transaction for those 7 years. It shows the date, the assumed purchase price on that day (taken from Yahoo – the purchase price is the average of the opening and closing price on that day) and the profit or loss. If you haven’t read my book, The Confident Investor, then you may not understand the timing of the trades. In fact, if you haven’t purchased the book and registered here on this site as a book owner then you won’t be able to see those individual trades. If you have registered and cannot see the trades, make sure you are logged in and refresh your browser.

Which brings me to the big set of questions. Shouldn’t you own this book? Does your investment strategy beat buy-and-hold? Do you even have an investment strategy? If your strategy beats buy-and-hold, does it beat GOPM – Growing on Other People’s Money?

You can purchase my book wherever books are sold such as Amazon, Barnes and Noble, and Books A Million. It is available in ebook formats for Nook, Kindle, and iPad. It may be available at your favorite bookstore as well but you may have to ask.

SAM 6 year chart from Google Finance

SAM chart


[s2If current_user_can(s2member_level1)]

Description of SAM trades table

While it may be obvious the meaning of the various columns, some of them definitely need a bit of explanation if you have never walked through a trading analysis with me.

Date – The date of the trade. It is important to note the long delays between trades. This will help you with your portfolio since you do not have to dedicate your average trade purchase (in this case $10,000) to just one stock but rather you can invest that money in the hottest stock at the time.

Buy/Sell – This is probably pretty obvious. On this date, did the system buy or sell the stock? The SELL will only sell from the previous transaction’s BUY.

Purch. Price – The selling or buying price of this transaction. This is taken from Yahoo’s Historical Pricing page and it is the average of the opening and closing price on that day.

Shares purchased – The number of shares that $10,000 will buy on that day.

Invested – The amount that was actually purchased. This is the number of shares (the previous column) multiplied by the Purch. Price column.

Returned – When you sell the shares from the previous BUY, the amount of money that results.

Profit/Loss – How much was profited from the previous BUY.

Free shares – If the SELL was profitable, how many shares was evenly divides into this profit.  These are free shares as they were purchased with Other People’s Money.

Excess – After the Free Shares are taken out, how much money is left over. If the transaction was not profitable, then what was the loss.

Running investment balance – A running total of the value of the investment.


SAM trades table


Date Action Purchase price Shares purchased Invested Returned Profit / Loss Free shares Excess Running investment balance
01/19/06 BUY 26.055 383 9979.065 0
01/25/06 SELL 26.03 9961.49 -17.575 -17.575 -17.575
02/15/06 BUY 26.12 382 9977.84 -17.575
02/22/06 SELL 25.875 9876.25 -101.59 -101.59 -119.165
02/27/06 BUY 25.93 385 9983.05 -119.165
03/06/06 SELL 26.275 10107.875 124.825 4 19.725 -99.44
03/08/06 BUY 26.525 376 9973.4 -99.44
03/16/06 SELL 26.935 10119.56 146.16 5 11.485 -87.955
03/23/06 BUY 27.205 367 9984.235 -87.955
03/27/06 SELL 26.905 9866.135 -118.1 -118.1 -206.055
04/05/06 BUY 27.23 366 9966.18 -206.055
04/10/06 SELL 26.92 9844.72 -121.46 -121.46 -327.515
04/19/06 BUY 27.27 366 9980.82 -327.515
04/27/06 SELL 27.1 9910.6 -70.22 -70.22 -397.735
05/03/06 BUY 27.24 366 9969.84 -397.735
05/08/06 SELL 27.095 9908.77 -61.07 -61.07 -458.805
05/31/06 BUY 26.82 372 9977.04 -458.805
06/05/06 SELL 26.71 9928.12 -48.92 -48.92 -507.725
06/20/06 BUY 27.04 369 9977.76 -507.725
07/13/06 SELL 29.005 10694.845 717.085 24 20.965 -486.76
07/31/06 BUY 29.09 343 9977.87 -486.76
08/29/06 SELL 31.54 10810.22 832.35 26 12.31 -474.45
09/15/06 BUY 33.625 297 9986.625 -474.45
09/22/06 SELL 33.51 9944.47 -42.155 -42.155 -516.605
10/11/06 BUY 33.1 301 9963.1 -516.605
11/01/06 SELL 36.01 10831.01 867.91 24 3.67 -512.935
11/22/06 BUY 35.71 279 9963.09 -512.935
11/28/06 SELL 35.695 9950.905 -12.185 -12.185 -525.12
11/29/06 BUY 35.785 279 9984.015 -525.12
12/15/06 SELL 36.465 10165.735 181.72 4 35.86 -489.26
03/20/07 BUY 34.315 291 9985.665 -489.26
03/28/07 SELL 33.62 9775.42 -210.245 -210.245 -699.505
05/08/07 BUY 34.2 292 9986.4 -699.505
06/07/07 SELL 38.09 11114.28 1127.88 29 23.27 -676.235
06/14/07 BUY 39.63 252 9986.76 -676.235
06/22/07 SELL 39.255 9884.26 -102.5 -102.5 -778.735
07/03/07 BUY 40.19 248 9967.12 -778.735
07/18/07 SELL 41.155 10198.44 231.32 5 25.545 -753.19
08/02/07 BUY 42.275 236 9976.9 -753.19
08/14/07 SELL 43.99 10373.64 396.74 9 0.83 -752.36
08/17/07 BUY 46.75 213 9957.75 -752.36
09/07/07 SELL 47.21 10047.73 89.98 1 42.77 -709.59
09/19/07 BUY 47.185 211 9956.035 -709.59
09/21/07 SELL 47.33 9978.63 22.595 0 22.595 -686.995
09/28/07 BUY 48.83 204 9961.32 -686.995
10/19/07 SELL 52.72 10746.88 785.56 14 47.48 -639.515
02/04/08 BUY 37.695 265 9989.175 -639.515
02/15/08 SELL 37.235 9859.275 -129.9 -129.9 -769.415
02/27/08 BUY 37.27 268 9988.36 -769.415
07/08/08 SELL 41.06 243 9977.58 -769.415
07/15/08 BUY 40.86 9920.98 -56.6 -56.6 -826.015
07/21/08 SELL 41.69 239 9963.91 -826.015
08/04/08 BUY 44.845 10709.955 746.045 16 28.525 -797.49
08/12/08 SELL 45.475 219 9959.025 -797.49
08/20/08 BUY 45.045 9856.855 -102.17 -102.17 -899.66
09/16/08 SELL 45.3 220 9966 -899.66
10/01/08 BUY 46.795 10286.9 320.9 6 40.13 -859.53
04/08/09 SELL 22.955 435 9985.425 -859.53
05/28/09 BUY 28.24 12276.4 2290.975 81 3.535 -855.995
06/03/09 SELL 29.525 338 9979.45 -855.995
06/10/09 BUY 29.48 9956.24 -23.21 -23.21 -879.205
06/25/09 SELL 29.06 343 9967.58 -879.205
07/07/09 BUY 29.74 10192.82 225.24 7 17.06 -862.145
07/15/09 SELL 29.89 334 9983.26 -862.145
07/17/09 BUY 29.825 9953.55 -29.71 -29.71 -891.855
07/23/09 SELL 29.81 335 9986.35 -891.855
08/28/09 BUY 40.09 13422.15 3435.8 85 28.15 -863.705
10/21/09 SELL 38.76 257 9961.32 -863.705
10/28/09 BUY 39.095 10039.415 78.095 1 39 -824.705
11/06/09 SELL 39.855 250 9963.75 -824.705
12/07/09 BUY 42.97 10734.5 770.75 17 40.26 -784.445
12/18/09 SELL 45.175 221 9983.675 -784.445
01/15/10 BUY 48.32 10670.72 687.045 14 10.565 -773.88
02/18/10 SELL 47.185 211 9956.035 -773.88
03/12/10 BUY 49.975 10536.725 580.69 11 30.965 -742.915
03/23/10 SELL 52.165 191 9963.515 -742.915
04/26/10 BUY 57.01 10880.91 917.395 16 5.235 -737.68
05/11/10 SELL 58.79 169 9935.51 -737.68
05/20/10 BUY 58.665 9906.385 -29.125 -29.125 -766.805
05/27/10 SELL 63.295 157 9937.315 -766.805
06/22/10 BUY 72.565 11384.705 1447.39 19 68.655 -698.15
07/09/10 SELL 69.74 143 9972.82 -698.15
07/15/10 BUY 69.48 9927.64 -45.18 -45.18 -743.33
07/23/10 SELL 70.51 141 9941.91 -743.33
07/29/10 BUY 70.65 9953.65 11.74 0 11.74 -731.59
09/08/10 SELL 67.475 148 9986.3 -731.59
09/22/10 BUY 67.965 10050.82 64.52 0 64.52 -667.07
10/15/10 SELL 68.59 145 9945.55 -667.07
12/29/10 BUY 97.255 14093.975 4148.425 42 63.715 -603.355
02/04/11 SELL 93.055 107 9956.885 -603.355
02/09/11 BUY 92.3 9868.1 -88.785 -88.785 -692.14
02/15/11 SELL 93.925 106 9956.05 -692.14
02/22/11 BUY 94.325 9990.45 34.4 0 34.4 -657.74
03/03/11 SELL 94.3 105 9901.5 -657.74
03/09/11 BUY 88.45 9279.25 -622.25 -622.25 -1279.99
03/31/11 SELL 91.99 108 9934.92 -1279.99
04/08/11 BUY 92.065 9935.02 0.1 0 0.1 -1279.89
04/19/11 SELL 91.9 108 9925.2 -1279.89
05/02/11 BUY 93.52 10092.16 166.96 1 73.44 -1206.45
06/21/11 SELL 87.17 114 9937.38 -1206.45
07/27/11 BUY 90.955 10360.87 423.49 4 59.67 -1146.78
10/10/11 SELL 83.11 120 9973.2 -1146.78
11/15/11 BUY 98.385 11798.2 1825 18 54.07 -1092.71
12/01/11 SELL 100.265 99 9926.235 -1092.71
01/03/12 BUY 107.29 10613.71 687.475 6 43.735 -1048.975
02/06/12 SELL 104.615 95 9938.425 -1048.975
02/09/12 BUY 102.715 9749.925 -188.5 -188.5 -1237.475
02/22/12 SELL 102.55 97 9947.35 -1237.475
03/22/12 BUY 100.135 99 9913.365 -1237.475
04/04/12 SELL 104.075 10295.425 382.06 3 69.835 -1167.64
05/02/12 BUY 107.215 93 9970.995 -1167.64
05/16/12 SELL 105.825 9833.725 -137.27 -137.27 -1304.91
06/06/12 BUY 106.64 93 9917.52 -1304.91
07/09/12 SELL 118.135 10978.555 1061.035 8 115.955 -1188.955
09/28/12 BUY 112.535 88 9903.08 -1188.955
10/01/12 SELL 108.25 9518 -385.08 -385.08 -1574.035
10/19/12 BUY 109.195 91 9936.745 -1574.035
10/22/12 SELL 107.855 9806.805 -129.94 -129.94 -1703.975
11/02/12 BUY 113.79 87 9899.73 -1703.975
11/12/12 SELL 112.045 9739.915 -159.815 -159.815 -1863.79
12/14/12 BUY 131.19 76 9970.44 -1863.79
12/27/12 SELL 135.215 10268.34 297.9 2 27.47 -1836.32

[/s2If]

I am regularly asked about the indicators that I use in my investment strategy. To refresh your memory, GOPM (Grow on Other People’s Money) is the strategy that I teach in my book, The Confident Investor. It has a couple of main tenets:

  1. You should only invest in truly Good Companies.
  2. You probably do not have enough money to have a balanced portfolio of “buy-and-hold” positions in truly Good Companies.

To get around the realities of the second tenet, I have developed a trading methodology to help. This methodology allows you to invest in companies that are currently experiencing a bull market. It also avoids those that are in a bear market. Almost all companies experience times when their stock price drops. This means that you have your money invested when the stock is going up, and it is invested elsewhere when the price is falling.

For the balance of this article, I am going to explain why I have modified some standard indicators. These indicators help to signal the bull and bear action of the stock. This explanation will only be available for registered owners of my book, The Confident Investor. If you own the book, you can register and log in to see the balance of this article. If you don’t own the book, you can purchase my book wherever books are sold such as AmazonBarnes and Noble, and Books A Million. It is available in e-book formats for NookKindle, and iPad. [s2If current_user_can(s2member_level1)]

The three main indicator types that I use are EMA, RSI and MACD. I suggest you set these indicators to use a multiple of 5 in the analysis. If you read some of the theory behind these indicators and the original math from the creators, you will find that none of them use a multiple of 5 as I suggest. My reasoning is important to understand.

In nearly every case of common usage, the popular value is larger than 5. In the case of RSI, it is 14. In the case of MACD, it typically is 12/26/9 (for the three different signal lines). In the case of EMA, you will often see values as high as 50, 100 or even 200. In my case, it is always 5, 10 or 20.  Why do I suggest a different time frame for all of these?

First let’s look at EMA of 200 or 100.  There are 250 trading days in a year or about 21 trading days in a month. This means that EMA(200) and EMA(100) are basically telling you if the stock has moved up in value for the past 10 or 5 months, respectively. This has almost no relevance if you are trying to decide to buy that stock today, tomorrow, or next Tuesday. The time frame that is relevant to that decision is this week or this month but not 5 months ago.

If you are trying to decide to buy today or not buy today, you need to look at what is happening now versus where the stock was a few days ago. There are 5 trading days (or bars) in a typical week (assuming no holidays). There are 10 days in 2 weeks and about 21 in a month. What is happening within the last week is very relevant. This week is more relevant than what happened 2 weeks ago which in turn is more relevant than what happened last month this time.

Most government indicators e.g. inflation rate, unemployment, etc. are on a monthly basis. By looking at 20 trading days, we are including a full cycle of most government indicators but not two or three. This is important as we want to make a decision based on what is happening now and not in history.

Not insignificant in this timing analysis is that the stock market is incredibly quarterly driven. Looking at a metric that is longer than a quarter is simply not relevant for understanding how most professional investors, mutual fund managers, and company executives are paid. They are paid to influence and capitalize on immediate returns.

Once you are comfortable with the concept of what is happening this week in a stock, you can quickly get comfortable with a 5 day increment. From that basis, it is easy to jump to 10 and 20.

Finally, it is important to remember that these three indicators were originally built in a different era. These indicators were developed when trades were in fractional increments of 1/8 rather than our current system of pennies. This means that stock movement was not nearly as fluid. A stock would jump by 12.5 cents per increment where today it moves in increments of 1 cent. That change in increment calls into question the original logic of the creating mathematician in suggesting the default time frame. Combining that change with the accelerated decision-making of the Information Age and a much larger marketplace, implies that a shorter time frame is necessary.[/s2If]

In a 7 year time frame from January 3, 2006 to December 31, 2012, Decker Corporation [stckqut]DECK[/stckqut] increased 304.7% if you would have implemented a pure buy-and-hold strategy. If you would implemented the strategy that I explain in my book, The Confident Investor, you would have seen a 371.2% return on your investment. This is a 21.8% increase on the profit percentage.

To put it into actual dollars, suppose you invested $10,000 in DECK on 1/3/2006. With the system that is explained in The Confident Investor, you would have exited the market on 12/31/2012 with $60,341.48. With my system, it is not uncommon for you to need a bit more cash available to cover the ongoing trades. Therefore, rather than $10,000, you would have needed $12,806.98 and your actual return would have been 371.2%. You would have 1,288 shares which were purchased with other people’s money and still have your original $10,000.

To be fair in our comparison, the buy-and-hold method if calculated with $12,763.85 would have ended up with $51,826.71 and a respectable 304.7%. You would have purchased 442 shares which had split 3:1 to 1326 shares but your original $12,806.98 would be tied up in the stock.

The profit on the buy-and-hold strategy in this scenario is $39,019.74.  The profit using GOPM (Grow on Other People’s Money) is $47,534.51.  That means the increased profit on DECK in this time frame was $8,514.77. This means your profit INCREASED by 21.8%!!

Understanding buy-and-hold is easy. You have a given amount of money, in this case $12,806.98. You buy 442 shares at the start of the test period. At the end of the test period, you sell the shares and the profit (or loss) is the standard that any other system must beat. In the case of DECK, the stock split 3:1 in the time period.

Understanding GOPM is a bit more complicated without reading my book, The Confident Investor. Before you even start to invest, the system teaches you to look for incredibly well-run companies and only invest in those companies. While DECK may or may not have qualified for this status in 2006, it does in 2013 so we are simply back-testing against a currently well-run company. While past performance doesn’t guarantee future performance, it is probably the best tool that we have to understand investment methodologies.

After you find a well-run company, you are going to buy $10,000 worth of shares when the technical indicators tell you that the stock has upward momentum. You are then going to sell those shares when that momentum slows down or reverses.  The profit that you make on that transaction, you will keep in the stock (in other words, you are not going to sell those shares). You are going to keep the $10,000 ready for when the stock has the correct momentum. If there is any excess profit (e.g. less than the value of a full share after keeping the $10,000) you will just stick that into your money-market account in this example. It is possible that you could invest this excess amount but we are going to simplify this example and just hold that money.

As a quick example, you invest $10,000 in a stock trading at $50 per share so you have purchased 200 shares.  Over the course of the next several days or weeks, the stock price increases to $55 which is where you decide to sell. To get your original capital of $10,000 back, you sell 182 shares resulting in $10,010 in your account and 18 shares that are essentially free since they were purchased with Other People’s Money. You now have your original capital of $10,000, 18 free shares and an additional $10.

Using this technique, you will make several trades per year and may even be trading weekly. Therefore, to make this model fair, I need to account for stockbroker fees and commissions.  In this example, I am using $8 for every sell and for every purchase. You may have a better fee from your favorite broker but $8 seems fair for a test. Frankly, if you are paying more than $10 for each transaction then you probably need to be looking at another broker!

Using this technique, by the end of the test on 12/31/2012 you would have 1,288 shares of DECK that cost you $2,806.98. Those 1,288 shares were acquired for $2.179 per share! This is significantly cheaper than today’s stock price and no matter what happens to DECK you could probably sell these shares for a profit at any time! You would still have the original $10,000 in your bank account! This is because you have purchased these share with Other People’s Money.  This is why I call my system GOPM – Grow on Other People’s Money.

The rest of this article shows each buy and sell transaction for those 7 years. It shows the date, the assumed purchase price on that day (taken from Yahoo – the purchase price is the average of the opening and closing price on that day) and the profit or loss. If you haven’t read my book, The Confident Investor, then you may not understand the timing of the trades. In fact, if you haven’t purchased the book and registered here on this site as a book owner then you won’t be able to see those individual trades. If you have registered and cannot see the trades, make sure you are logged in and refresh your browser.

Which brings me to the big set of questions. Shouldn’t you own this book? Does your investment strategy beat buy-and-hold? Do you even have an investment strategy? If your strategy beats buy-and-hold, does it beat GOPM – Growing on Other People’s Money?

You can purchase my book wherever books are sold such as Amazon, Barnes and Noble, and Books A Million. It is available in ebook formats for Nook, Kindle, and iPad. It may be available at your favorite bookstore as well but you may have to ask.

DECK 2006-12

Additional commentary not originally published with this article.
When this article was originally published, the following paragraphs were not included.

At the time that I wrote the article, I hadn’t discussed portfolio management on my site to any great detail. Recently, I discussed the concept of doubling your investment to the point that the free stock is equal to one allotment of your portfolio. Now that this concept has been explained, I need to add another metric to the Deckers analysis.

If you would have invested in Deckers as described in this article, you would have doubled your investment by March 2, 2007. By that date, you would have acquired 150 shares of DECK which were valued at about $67.45 for a total profit of $10,101.75. This means your $10,000 initial investment would have doubled.

This event would have occurred 292 trading days after you initiated trading on DECK. If you followed my advice on portfolio management, you would stop trading in DECK at this point and focus on other stocks to build up equity in them.

[s2If current_user_can(s2member_level1)]


Description of DECK trades table
While it may be obvious the meaning of the various columns, some of them definitely need a bit of explanation if you have never walked through a trading analysis with me.
Date – The date of the trade. It is important to note the long delays between trades. This will help you with your portfolio since you do not have to dedicate your average trade purchase (in this case $10,000) to just one stock but rather you can invest that money in the hottest stock at the time.
Buy/Sell – This is probably pretty obvious. On this date, did the system buy or sell DECK? The SELL will only sell from the previous transaction’s BUY.
Purch. Price – The selling or buying price of this transaction. This is taken from Yahoo’s Historical Pricing page and it is the average of the opening and closing price on that day.
Share – The number of shares that $10,000 will buy on that day.
Invest – The amount that was actually purchased. This is the number of shares (the previous column) multiplied by the Purch. Price column.
Returned – When you sell the shares from the previous BUY, the amount of money that results.
Profit/Loss – How much was profited from the previous BUY.
Free shares – If the SELL was profitable, how many shares was evenly divides into this profit.  These are free shares as they were purchased with Other People’s Money.
Excess – After the Free Shares are taken out, how much money is left over. If the transaction was not profitable, then what was the loss.
Running investment balance – A running total of the value of the investment.

DECK trades table
Date Action Purchase Price Shares Invested Returned Profit / Loss Free shares Excess Running investment balance
1/5/2006 BUY $29.83 335 $9,991.38 $0.00
1/19/2006 SELL $31.09 $10,405.48 $414.10 13 $10.00 $404.11
2/1/2006 BUY $32.62 306 $9,981.72 $424.06
2/7/2006 SELL $31.88 $9,747.28 ($234.44) ($234.44) $414.44
2/22/2006 BUY $32.38 308 $9,973.04 $420.94
3/7/2006 SELL $35.33 $10,873.64 $900.60 25 $17.35 $1,342.54
3/20/2006 BUY $36.86 271 $9,989.06 $1,400.68
4/11/2006 SELL $40.51 $10,968.86 $979.80 24 $7.68 $2,511.31
4/25/2006 BUY $42.51 235 $9,989.85 $2,635.62
5/8/2006 SELL $43.10 $10,119.33 $129.47 3 $0.19 $2,801.18
6/30/2006 BUY $38.28 261 $9,991.08 $2,488.20
7/7/2006 SELL $37.43 $9,761.23 ($229.85) ($229.85) $2,432.95
7/25/2006 BUY $38.06 262 $9,971.72 $2,473.90
8/10/2006 SELL $43.00 $11,256.69 $1,284.97 29 $38.11 $4,041.53
9/8/2006 BUY $42.67 234 $9,983.61 $4,010.51
10/17/2006 SELL $49.56 $11,587.87 $1,604.26 32 $18.50 $6,243.93
11/8/2006 BUY $52.99 188 $9,961.18 $6,676.11
11/24/2006 SELL $54.42 $10,222.02 $260.84 4 $43.18 $7,073.95
12/1/2006 BUY $56.12 178 $9,988.47 $7,294.95
1/4/2007 SELL $58.73 $10,445.05 $456.58 7 $45.50 $8,045.33
2/1/2007 BUY $58.56 170 $9,954.35 $8,022.04
2/23/2007 SELL $63.86 $10,848.20 $893.85 13 $63.67 $9,579.00
3/1/2007 BUY $66.00 151 $9,965.25 $9,899.25
3/27/2007 SELL $72.11 $10,879.86 $914.61 12 $49.35 $11,681.01
4/16/2007 BUY $72.25 138 $9,970.50 $11,704.50
4/24/2007 SELL $73.13 $10,083.25 $112.75 1 $39.63 $11,919.38
4/27/2007 BUY $73.99 135 $9,988.65 $12,060.37
7/11/2007 SELL $101.62 $13,710.03 $3,721.38 36 $63.23 $20,221.39
7/23/2007 BUY $105.68 94 $9,933.92 $21,030.32
7/24/2007 SELL $103.72 $9,741.21 ($192.71) ($192.71) $20,639.29
9/18/2007 BUY $100.87 99 $9,986.13 $20,073.13
10/11/2007 SELL $112.21 $11,100.30 $1,114.17 9 $104.32 $23,338.64
10/22/2007 BUY $112.82 88 $9,928.16 $23,466.56
11/9/2007 SELL $127.50 $11,212.00 $1,283.84 10 $8.84 $27,795.00
11/26/2007 BUY $133.21 75 $9,990.38 $29,038.69
12/31/2007 SELL $157.08 $11,773.00 $1,782.63 11 $54.75 $35,971.32
4/2/2008 BUY $112.68 88 $9,915.84 $25,803.72
4/9/2008 SELL $112.31 $9,875.28 ($40.56) ($40.56) $25,718.99
4/17/2008 BUY $117.26 85 $9,966.68 $26,851.40
4/23/2008 SELL $117.00 $9,936.58 ($30.10) ($30.10) $26,791.86
4/25/2008 BUY $138.85 71 $9,858.00 $31,795.51
5/7/2008 SELL $139.95 $9,928.10 $70.10 0 $70.10 $32,047.41
6/20/2008 BUY $137.21 72 $9,879.12 $31,421.09
7/2/2008 SELL $135.41 $9,741.52 ($137.60) ($137.60) $31,008.89
12/16/2008 BUY $65.36 152 $9,934.72 $14,967.44
1/7/2009 SELL $79.07 $12,010.64 $2,075.92 26 $20.10 $20,162.85
3/24/2009 BUY $49.73 200 $9,946.00 $12,681.15
4/15/2009 SELL $60.73 $12,137.00 $2,191.00 36 $4.90 $17,670.98
6/1/2009 BUY $60.25 165 $9,940.43 $17,531.30
7/2/2009 SELL $69.44 $11,449.60 $1,509.18 21 $50.94 $21,665.28
7/15/2009 BUY $68.89 145 $9,988.33 $21,492.12
7/24/2009 SELL $68.16 $9,874.48 ($113.85) ($113.85) $21,264.36
8/12/2009 BUY $69.37 144 $9,988.56 $21,641.88
8/17/2009 SELL $68.74 $9,890.56 ($98.00) ($98.00) $21,446.88
9/14/2009 BUY $70.91 140 $9,926.70 $22,122.36
10/1/2009 SELL $83.11 $11,626.70 $1,700.00 20 $37.90 $27,590.86
10/14/2009 BUY $87.56 114 $9,981.27 $29,068.26
10/28/2009 SELL $93.40 $10,639.03 $657.76 7 $4.00 $31,660.91
11/9/2009 BUY $95.66 104 $9,948.12 $32,427.05
11/19/2009 SELL $96.75 $10,053.48 $105.36 1 $8.61 $32,893.30
12/4/2009 BUY $97.92 102 $9,987.84 $33,292.80
12/15/2009 SELL $97.52 $9,939.04 ($48.80) ($48.80) $33,156.80
12/28/2009 BUY $98.13 101 $9,911.13 $33,364.20
1/20/2010 SELL $107.73 $10,872.23 $961.09 8 $99.29 $37,488.30
2/24/2010 BUY $101.89 98 $9,985.22 $35,457.72
4/12/2010 SELL $136.41 $13,360.18 $3,374.96 24 $101.12 $50,744.52
4/22/2010 BUY $139.83 71 $9,927.93 $52,016.76
4/30/2010 SELL $145.59 $10,328.54 $400.61 2 $109.44 $54,448.79
6/1/2010 BUY $142.70 70 $9,988.65 $53,367.93
6/22/2010 SELL $158.74 $11,103.45 $1,114.80 7 $3.66 $60,478.04
7/27/2010 BUY $50.94 196 $9,983.26 $58,218.71
8/6/2010 SELL $49.29 $9,652.84 ($330.42) ($330.42) $56,338.47
9/17/2010 BUY $47.64 209 $9,955.72 $54,446.81
9/22/2010 SELL $47.19 $9,853.67 ($102.05) ($102.05) $53,932.46
9/24/2010 BUY $47.39 210 $9,951.90 $54,166.77
10/7/2010 SELL $50.21 $10,535.05 $583.15 11 $30.89 $57,936.57
10/12/2010 BUY $51.35 194 $9,960.93 $59,252.13
10/19/2010 SELL $52.56 $10,187.67 $226.74 4 $16.52 $60,858.69
10/26/2010 BUY $54.55 183 $9,982.65 $63,168.90
12/28/2010 SELL $84.22 $15,403.35 $5,420.70 64 $30.94 $102,910.73
2/7/2011 BUY $82.82 120 $9,938.40 $101,206.04
3/1/2011 SELL $86.25 $10,342.00 $403.60 4 $58.60 $105,742.50
3/30/2011 BUY $86.53 115 $9,950.95 $106,085.78
4/12/2011 SELL $87.74 $10,081.53 $130.57 1 $42.84 $107,650.85
4/18/2011 BUY $92.28 108 $9,966.24 $113,227.56
4/29/2011 SELL $86.03 $9,282.70 ($683.54) ($683.54) $105,552.68
5/26/2011 BUY $90.18 110 $9,919.25 $110,644.73
6/1/2011 SELL $89.86 $9,876.60 ($42.65) ($42.65) $110,258.22
6/30/2011 BUY $87.82 113 $9,923.66 $107,755.14
7/27/2011 SELL $93.59 $10,567.67 $644.01 6 $82.47 $115,396.47
8/1/2011 BUY $101.26 98 $9,923.48 $124,853.58
8/4/2011 SELL $98.03 $9,598.94 ($324.54) ($324.54) $120,870.99
9/8/2011 BUY $90.67 110 $9,973.70 $111,796.11
9/22/2011 SELL $95.05 $10,447.50 $473.80 4 $93.60 $117,576.85
10/7/2011 BUY $100.48 99 $9,947.03 $124,287.58
10/18/2011 SELL $101.96 $10,086.04 $139.02 1 $37.06 $126,226.48
10/28/2011 BUY $114.22 87 $9,936.71 $141,398.17
11/9/2011 SELL $108.14 $9,399.75 ($536.96) ($536.96) $133,871.13
2/8/2012 BUY $86.43 115 $9,939.45 $107,000.34
2/10/2012 SELL $84.40 $9,698.00 ($241.45) ($241.45) $104,487.20
2/16/2012 BUY $87.53 114 $9,977.85 $108,355.95
2/24/2012 SELL $79.33 $9,035.62 ($942.23) ($942.23) $98,210.54
8/15/2012 BUY $45.48 219 $9,960.12 $56,304.24
9/4/2012 SELL $49.04 $10,731.76 $771.64 15 $36.04 $61,447.12
11/27/2012 BUY $35.69 280 $9,991.80 $44,713.31
12/10/2012 SELL $40.90 $11,442.60 $1,450.80 35 $19.47 $52,672.76
[/s2If]

I believe the most important part of my system is the identification of great companies. If your bank account was sufficiently large, you could simply buy stock in these great companies and sit on it. This may not maximize your investment but it would be the least amount of work. All you would have to do is monitor the continued success of the individual companies and re-balance occasionally.

The reality is that few of us are so wealthy that we can buy a sufficient quantity of 20-30 stocks to just sit on. This is why so many people invest in mutual funds that eventually under-perform the market. To offset this lack of funds, my system allows you to move your money between companies on your watch list and hold only those companies that are currently experiencing a bull market and avoid those that are moving sideways or downward. I call this system, GOPM (Growing on Other People’s Money). It works quite well at growing your stock portfolio in those companies that are on your watch list.

The heart of GOPM trading management is technical analysis or at least chart analysis. While I do not suggest that you are a pure technical trader, I think there are extremely good signals that you can follow that help you avoid the downturn in the market. I am not going to get into specifics on my favorite indicators, but here are some common sense nuggets that should be used with my favorite indicators as well as all others.

  1. After a long positive run, don’t jump back in 3-5 days later. If the stock is bouncing back and forth between sell and buy signals then you should interpret that as being a hold or wait.
  2. Avoid buying or selling when much of the finance industry is taking a long vacation. The most obvious periods where you should be hesitant to believe the charts and the technical signals are July 4, Christmas, and Thanksgiving. Just assume that the most senior traders are spending time with their families and the folks running the office are young enough that they can remember their first legal beer purchase.
  3. Don’t sell the day after you bought unless the stock just took a hit and there was a news event. This is a corrollary to number 1 above. Just because a technical indicator reversed on you doesn’t mean you should do a knee jerk reaction.
  4. Weird stuff happens during earnings announcements. Sometimes it works for you and sometimes it is against you. I know traders that purposefully sell their shares a week before earnings announcements just to avoid the crowd mentality of everyone going over the cliff like a lemming. I don’t necessarily subscribe to this waiting period but if I have had a good run with a stock, I may sit out for a week or two around earnings time.
  5. Be wary of false buy signals that appear in a sideways channel. It is important to learn how to recognize a sideways channel. Many technical indicators can give bad signals in a sideways channel so be suspicious of any buy or sell signal.
  6. If a company has been trending up or down for a while, don’t panic buy or sell when they have a momentary blip and the trend seems to be reversing. Wait a few days to see what is really happening. Companies usually continue to trend until they find a ceiling or floor. That limit is usually tested a few times before it is firm. The first apparent reversal of a trend is typically not a reversal and, at best, the first testing of a limit. Trading while the limit is being established only ties up your cash at best and possibly is money losing if the limit doesn’t hold.

Some thoughts for readers of my book, The Confident Investor.
For many of you reading this, this article will end here. However, if you are a registered owner of my book, The Confident Investor, I am sharing some further guidance that is uniquely beneficial to those readers. You can purchase my book wherever books are sold such as Amazon, Barnes and Noble, and Books A Million. It is available in ebook formats for Nook, Kindle, and iPad. It is free to register for any owner of my book. [s2If current_user_can(s2member_level1)]

  • RSI is a soft indicator and not a must sell or don’t buy indicator. In my book I tell you to watch 70 on the RSI scale and not buy a stock if it has gone above 70. In reality, 70 is not a hard number and you dont want to overreact to cycling above and below 70 on RSI. There are times when a stock will go up to 71, drop to 69, then back up to 70.5 and then back down again. This is not the situation that you are trying to avoid. You simply want to avoid a stock going well above 70 (perhaps 72 and higher) and then staying there for a a couple days.
  • MACD tends to be cyclical. It is often possible for you to assume that the MACD will go positive or negative soon. It is perfectly fine to get a jump on the market and buy or sell as the MACD starts to approach zero. This may slightly increase your profitability.
  • One of the easiest ways to see a channel situation is by looking at the 5, 10, and 20-day EMA. If the gap between 5 and 10 is about the same as the gap between 10 and 20 then you need to be concerned that it is a sidways channel. This is even more true if the gaps have been roughly the same for a couple days or so. As I mention above, you need to be cautious about trading in a sideways channel.
  • Be wary of down markets. Before you check to see your individual stocks, run the 3 main indicators of my book on the S&P 500 and the Dow Jones Industrial Average. These indicators (5,10,20 EMA, MACD, and RSI) will tell you if the market as a whole is dropping or growing. You may want to take this into account when you look at your individual stocks. There are times when the entire market is down that you may want to hold on for another day or two before selling your individual stock even though it’s indicators showed sell. Sometimes, when the market rebounds, your stock will rebound as well and you can stay in the stock for a longer period and make more money.[/s2If]

In my book The Confident Investor I detail a possible trading example using 3 different methodologies.

  1. Traditional “Buy and Hold” strategy
  2. Traditional “Even incremental investment over time”
  3. My GOPM strategy – “Grow on Other People’s Money”

I chose the example around IBM [stckqut]ibm[/stckqut] because it is such a well-known brand even if it may not be the best of companies in which to invest. I felt that it was important to show that my technique works with most fair companies. It works even better on a good company.

I also specifically chose 2007 and 2008 as my example time period. I chose this example since many people still do not invest in stocks due to the plunge that happened in November 2008. This plunge wiped out considerable value in the stock market and persuaded too many people that investing in stocks is foolish. My example shows that if you stick with the “traditional” methods of incremental investing and buy-and-hold then you will be very susceptible to these market corrections. GOPM tends to reduce this exposure and even take advantage of it.

The tag line of this site and of my book is “Learn How to Invest With Confidence in a Turbulent Market” and there were few times in the last 15 years when the market was more turbulent that 2007 and 2008.  So I chose the worst of times to explain how my GOPM method can make it the best of times.

In the first scenario, an investor buys IBM stock and sits on it.  A traditional buy-and-hold technique.  He loses money in the crash and like too many people gives up on the stock market as a method to provide for his retirement.

In the second scenario, an investor invests $2,000 in IBM every 3 months. He ultimately takes a bath in the fall of 2008.

In the third scenario, an investor has read my book and uses GOPM – Grow on Other People’s Money. Obviously, the crash of 2008 affects him but he loses none of his capital and has acquired 39 shares of stock in IBM for only $7.22 per share or about 10% of the value of the stock at the time (after the crash, IBM stock had dropped to about $75).

I used a slight variation of my traditional technique for simplicity. Typically, I suggest that an investor invest the same dollar amount using GOPM techniques but in this case I varied the dollar and bought 100 shares of stock in each transaction. Had I used the same dollar amount, the return would have been slightly higher but the math would have been a bit more complicated to explain in this very first example of the technique.

If you are concerned about a major correction in the stock market wiping out your net worth, you really should read my book. You can read a sample of the book here and it includes Chapter 4 which is the chapter containing this IBM explanation.

If you are a registered reader of my book then you will be able to see the table below that shows the time of each GOPM trade and the profit or loss from that trade. It is FREE to register for anyone that has purchased my book.[s2If current_user_can(s2member_level1)]

  Invest Commission Total Profit Shares Free shares saved Cash
04/02/07 $9,521.00 $10.00 $9,531.00   100.00    
05/16/07 $10,587.00 $10.00 $10,577.00 $1,046.00 9.88 9 $93.17
06/19/07 $10,650.00 $10.00 $10,660.00   100.00    
06/19/07 $952.83 $0.00 $952.83   9.00    
07/30/07 $11,452.00 $10.00 $11,442.00 $782.00 100.00    
07/30/07 $1,030.68 $0.00 $1,030.68 $77.85 7.51 7 $58.21
08/28/07 $11,200.00 $10.00 $11,210.00   100.00    
08/28/07 $1,832.32 $0.00 $1,832.32   16.00    
09/17/07 $11,452.00 $10.00 $11,442.00 $232.00 100.00    
09/17/07 $1,832.32 $0.00 $1,832.32 $0.00 2.03 2 $2.96
12/20/07 $10,886.00 $10.00 $10,896.00   100    
12/20/07 $2,061.36 $0.00 $2,061.36   18    
12/31/08 $10,810.00 $10.00 $10,800.00 -$96.00 100    
12/31/08 $1,945.80 $0.00 $1,945.80 -$115.56     -$211.56
01/20/08 $10,498.00 $10.00 $10,508.00   100    
01/20/08 $1,945.80 $0.00 $1,945.80   18    
02/08/08 $10,327.00 $10.00 $10,317.00 -$191.00 100    
02/08/08 $1,858.86 $0.00 $1,858.86 -$86.94     -$277.94
02/12/08 $10,653.00 $10.00 $10,663.00   100    
02/12/08 $1,858.86 $0.00 $1,858.86   18    
03/17/08 $11,394.00 $10.00 $11,384.00 $721.00 100    
03/17/08 $2,050.92 $0.00 $2,050.92 $192.06 8.01 8 $1.54
04/15/08 $11,717.00 $10.00 $11,727.00   100    
04/15/08 $2,962.44 $0.00 $2,962.44   26    
04/29/08 $12,285.00 $10.00 $12,275.00 $343.00 100    
04/29/08 $3,194.10 $0.00 $3,194.10 $231.66 4.68 4 $83.26
05/13/08 $12,658.00 $10.00 $12,668.00   100    
05/13/08 $3,685.50 $0.00 $3,685.50   30    
05/20/08 $12,518.00 $10.00 $12,508.00 -$160.00 100    
05/20/08 $3,755.40 $0.00 $3,755.40 $69.90     -$90.10
07/15/08 $12,320.00 $10.00 $12,330.00   100    
07/15/08 $3,755.40 $0.00 $3,755.40   30    
08/11/08 $12,660.00 $10.00 $12,650.00 $320.00 $100.00    
08/11/08 $3,798.00 $0.00 $3,798.00 $42.60 2.86 2 $109.40
               
            32 -$231.06
              -$7.22

[/s2If]