I admit it. I love coffee. I regularly start my day with 2 cups of coffee as I look through my stock investments before I go to work. During the day, I will have another one or two cups.

Earlier in my life, I traded commodities as an investment strategy. I traded in coffee as a commodity. However, as I grew more experienced in trading commodities I realized that I could make more money using commodity trading principles in great companies. From that experience, I began to teach my friends how to trade and ultimately created The Confident Investor (I discuss this more in my book, The Confident Investor). I don’t trade stocks for a living, I trade them for my retirement. I actually have a full-time job and I make more doing that job than most people that are in the stock market make. I also tend to have a higher rate of return for my investments than most people in the stock market (check out my Weekly Portfolio Gain posts for how much I beat the market).

You can purchase my book wherever books are sold such as Amazon, Barnes and Noble, and Books A Million. It is available in e-book formats for Nook, Kindle, and iPad.

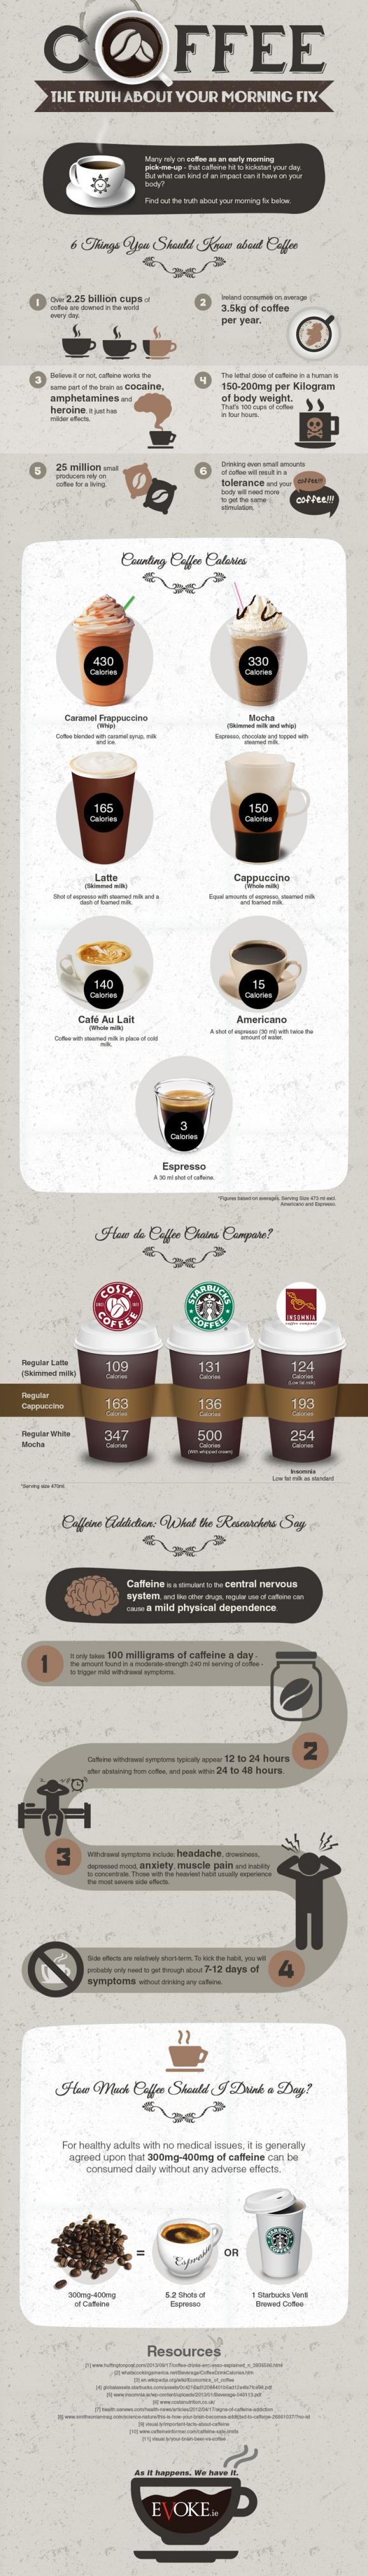
While I no longer invest in coffee as an investment vehicle, I still love the beverage. Coffee is a brewed drink prepared from roasted coffee beans, which are the seeds of berries from the Coffea plant. The genus Coffea is native to tropical Africa, and Madagascar, the Comoros, Mauritius and Réunion in the Indian Ocean. The plant was exported from Africa to countries around the world and coffee plants are now cultivated in over 70 countries, primarily in the equatorial regions of the Americas, Southeast Asia, India, and Africa. The two most commonly grown are the highly regarded arabica, and the less sophisticated but stronger and more hardy robusta. Once ripe, coffee berries are picked, processed, and dried. Dried coffee seeds (referred to as beans) are roasted to varying degrees, depending on the desired flavor. Roasted beans are ground and brewed with near boiling water to produce coffee as a beverage.

Coffee is slightly acidic and can have a stimulating effect on humans because of its caffeine content. Coffee is one of the most popular drinks in the world. It can be prepared and presented in a variety of ways (e.g., espresso, French press, cafe latte, etc.). It is usually served hot, although iced coffee is also served. Clinical studies indicate that moderate coffee consumption is benign or mildly beneficial in healthy adults, with continuing research on whether long-term consumption inhibits cognitive decline during aging or lowers the risk of some forms of cancer.

The earliest credible evidence of coffee-drinking appears in the middle of the 15th century in the Sufi shrines of Yemen. It was here in Arabia that coffee seeds were first roasted and brewed in a similar way to how it is now prepared. Coffee seeds were first exported from East Africa to Yemen, as the coffea arabica plant is thought to have been indigenous to the former. Yemeni traders took coffee back to their homeland and began to cultivate the seed. By the 16th century, it had reached Persia, Turkey, and North Africa. From there, it spread to Europe and the rest of the world.

Coffee is a major export commodity: it is the top agricultural export for numerous countries and is among the world’s largest legal agricultural exports. It is one of the most valuable commodities exported by developing countries. Green (unroasted) coffee is one of the most traded agricultural commodities in the world. Some controversy is associated with coffee cultivation and the way developed countries trade with developing nations and the impact of its cultivation on the environment, in regards to clearing of land for coffee-growing and water use. Consequently, the markets for fair trade coffee and organic coffee are expanding.

The time was when the internet was people on their PCs sending email and surfing web content dished up by servers. Sure, it was around before that in its academic/military guise, but as far as the public consciousness was concerned, PCs, laptops, email and the web, was all the internet meant. A few years ago that changed, imperceptibly at first, such that now the recurrent understanding of the internet is far more diverse, feral even. Myriad devices and people creating content in multiple forms, for consumption on an increasing array of devices. And it’s changing industry too- internet-connected combine harvesters, anyone? It has become known as the internet of things, guided by the fact that if something has an on/off switch, it should probably compute, and if it is going to compute, it should also connect to the internet.

There are roughly 10 billion devices connected to the web today. By 2020, Intel estimates there will be 31 billion devices connected. Here are some other predictions for the IoT in 2020:

  • IDC forecasts the market to be worth $7.1 trillion
  • Cisco has estimated by then, 5 billion people and 50 billion devices will be connected
  • Morgan Stanley feels the number should be even higher: up to 75 billion devices connected in 2020

Regardless of whether it is 30 or 75 billion, that number is still huge – and investors need to stay on top of this development. There is no shortage of opportunities!

My personal preference is that companies keep their stock price below $200 per share. My logic is simple: it makes it easier to evenly distribute your investment portfolio.

My balanced portfolio logic is quite simple. If you want to balance your portfolio quarterly between 10 great stocks, it is easier with lower-priced stocks. With a stock that is trading at $200, you can easily hold the correct number of shares to be within $100 (half the per share price) of the target value. With a stock that is trading at $1200 per share, the variance is now $600 which can easily throw off the balanced exposure for a small investor like most of my readers.

I discuss two types of portfolios on this site and in my book, The Confident Investor, which you can buy wherever books are sold. The more cautious portfolio suggests a target portfolio allocation for each purchase but is based on a fast-response momentum philosophy that moves that allocation to whichever stock is increasing in price at the moment. The stocks to invest in are chosen by the quality of the company and I list them on my Watch List. This portfolio regularly beats the market over time by at least 20% (if not 50%) regardless if the market is bull, bear, or flat.

The second type of portfolio is much more aggressive and often is 3X-4X the market increase in a bull market. However, it is not as safe in a flat or bear market. This strategy evenly divides a portfolio among 15 great companies that are growing their stock price faster than the others on my Watch List. I recalculate the top 15 and rebalance the portfolio quarterly.

In both portfolios, it is easier to balance the portfolio or allocate each portion of the portfolio if the stock price is under $200. When the stock is over $200, most investors that are working with a portfolio under $250,000 find themselves to heavy or too light in high-cost stocks.

You can see the performance of my version of both portfolios by reading my regular posts that are in the category Weekly Portfolio Gain. You do not need to have read my book to see these results although you may not understand how I create the list of companies.

Stock splits, once considered a way to keep shares affordable for mom-and-pop investors, are rare today as companies aspire to new heights.

Amazon [stckqut]AMZN[/stckqut], Google [stckqut]GOOGL[/stckqut], and Priceline [stckqut]PCLN[/stckqut] are recent examples of companies that have let their stock prices approach or exceed a four-figure price.

In the 1990s, when stock picking for one’s own account was in vogue, companies also considered splits a way to keep shares affordable for mom-and-pop investors. Even though nothing changes fundamentally about the company with a stock split—it’s like trading a dime for two nickels—splits used to generate excitement and, often, a short-term pop for the shares.

In recent years, though, individuals have gravitated toward index funds. And institutional investors don’t like stock splits, because increasing the number of shares increases their trading costs.

The godfather of the no-split camp is Berkshire Hathaway Inc. [stckqut]BRK.A[/stckqut] Chairman Warren Buffett. Berkshire’s Class A shares are the priciest U.S.-listed equities at the time of this writing. For years, Mr. Buffett said he didn’t want to split the shares because he didn’t want to attract people who found such a move to be a good reason for buying a stock. “People who buy for non-value reasons are likely to sell for non-value reasons,” he said in a 1984 letter to shareholders.

There are reasons behind the trend. Before the rise of discount brokerages and a decline in trading commissions in the 1990s, even small-time investors often had to buy shares in round lots of 100, which meant that a high price could make such a purchase prohibitively expensive. These days, though, retail investors can buy as little as one share, and often pay commissions of $10 or less.

Academics who have studied share splits have also posited that executives who split their company’s stock may be motivated by a desire to keep their share prices from looking expensive. Now, some companies and their investors seem to treat higher stock prices as a sign of accomplishment. Of course, this bragado is just as foolish as calling a $50 stock: cheap.

A fair concern is companies may have held off on splitting shares in recent years in response to the financial crisis, when stock prices dropped sharply and some big companies were humbled into performing reverse splits to raise their share price to avoid being delisted. Reverse stock splits are embarrassing and painful and of course being delisted is the equivalent of death in the stock market.

Amazon founder and CEO Jeff Bezos hasn’t ruled out the idea of a split, which the firm did three times as a young public company. A shareholder at Amazon’s annual meeting in Seattle on Tuesday asked Mr. Bezos if he would consider splitting the company’s shares to give members of the middle class and younger people the chance to afford the shares.

You can purchase my book wherever books are sold such as Amazon, Barnes and Noble, and Books A Million. It is available in e-book formats for Nook, Kindle, and iPad.

Source: Amazon’s Brush With $1,000 Signals the Death of the Stock Split

One of the biggest challenges in investing in the stock market is picking the best stocks. In my book, “The Confident Investor” I teach my readers how to pick Good Companies. This page is designed to show the raw performance of these companies. It is not designed to show my personal portfolio, which may or may not exceed the performance stated here. Since I use the trading system described in my book, you can assume that I beat the performance recorded here.

I have created three tables below. The first table is the general market – NASDAQ and S&P500. Every investor should try to beat the average of these two indexes. In this report, my larger Watch List beats this metric easily.

I must caution you, I do not actually propose that you “buy and hold” any given stock, but rather you should “buy to hold” the stock. My investing technique teaches you to efficiently move your money to the stocks that are currently increasing in value the most. I use my Watch List for this work, these are Good Companies that I wait for great buying opportunities. This strategy is well described in my book, “The Confident Investor” and tends to be a very safe strategy in bear markets while typically still providing above market returns in a bull or flat market.

My Short Term Watch List are 15 companies that are hot right now. I select this list every quarter. I evenly divide a portion of my portfolio among these 15 companies. The next quarter, I add or delete companies as necessary and then re-balance the portfolio. This tends to be a more risky strategy because I don’t bail out on bad stock movement (at least until the end of the quarter). In a bull market or a flat market, these very well-run and high-performing companies tend to beat the general market by a significant margin.

BL-TCI-cover

You can purchase my book wherever books are sold such as Amazon, Barnes and Noble, and Books A Million. It is available in paperback as well as e-book formats for Nook, Kindle, and iPad.

Stock Indexes Performance

1 week ago 1 month ago 1 quarter ago 1 year ago
Index Close Profit % Close Profit % Close Profit % Close Profit
^GSPC $2,399.29 -0.35% $2,328.95 2.66% $2,337.58 2.28% $2,046.61 16.82%
^IXIC $6,100.76 0.34% $5,805.15 5.44% $5,782.57 5.86% $4,717.68 29.75%

Week average for Indexes: -0.01%
Month average for Indexes: 4.05%
Quarter average for Indexes: 4.07%
Year average for Indexes: 23.29%

Watch List Performance

1 week ago 1 month ago 1 quarter ago 1 year ago
Stock Close Profit % Close Profit % Close Profit % Close Profit
AAPL $148.35 5.23% $140.47 11.13% $134.46 16.09% $88.82 75.75%
ABMD $133.03 -1.21% $124.61 5.47% $108.96 20.61% $94.08 39.69%
ALGN $138.03 0.46% $113.73 21.93% $98.39 40.94% $76.08 82.27%
ALXN $128.82 -6.78% $118.35 1.46% $129.50 -7.27% $139.74 -14.07%
AMAT $41.83 3.85% $37.52 15.78% $35.13 23.66% $19.34 124.61%
AMZN $934.15 2.91% $884.67 8.67% $836.39 14.94% $709.92 35.42%
AYI $185.20 -6.36% $172.72 0.41% $211.79 -18.11% $246.75 -29.71%
AZPN $58.64 -0.46% $58.50 -0.22% $56.16 3.94% $37.25 56.70%
BABA $116.04 3.71% $110.21 9.19% $101.59 18.46% $77.16 55.96%
BWLD $160.35 -1.87% $150.75 4.38% $157.60 -0.16% $134.71 16.81%
CBPO $117.05 -5.88% $108.34 1.69% $112.95 -2.46% $115.01 -4.21%
COF $81.87 -3.01% $80.62 -1.52% $89.74 -11.52% $67.28 18.01%
CRUS $63.71 0.42% $61.64 3.80% $53.36 19.90% $31.36 104.02%
CVCO $118.50 -1.56% $114.80 1.61% $112.60 3.60% $95.91 21.62%
DPZ $193.12 1.12% $174.04 12.20% $184.45 5.87% $120.69 61.80%
EW $110.58 0.01% $94.30 17.27% $89.49 23.58% $102.99 7.38%
EXR $73.39 -1.32% $78.10 -7.27% $72.73 -0.43% $89.32 -18.93%
FB $150.24 0.06% $139.39 7.85% $133.85 12.31% $119.81 25.47%
GOOGL $950.28 0.51% $840.18 13.68% $840.03 13.70% $724.83 31.77%
GTN $13.10 -3.05% $14.50 -12.41% $12.50 1.60% $11.11 14.31%
GWR $64.47 -0.11% $64.80 -0.62% $74.51 -13.57% $56.56 13.86%
HDSN $7.10 9.86% $6.51 19.82% $7.72 1.04% $3.53 120.96%
HOG $56.19 -1.74% $59.70 -7.52% $57.74 -4.38% $44.36 24.47%
HSKA $91.70 3.85% $101.64 -6.31% $82.47 15.47% $39.56 140.72%
HZO $19.35 -3.62% $20.70 -9.90% $21.65 -13.86% $17.71 5.31%
IDXX $162.47 0.46% $153.60 6.26% $141.60 15.27% $86.67 88.32%
LNCE $34.22 5.64% $39.92 -9.44% $37.44 -3.43% $30.43 18.80%
LULU $51.95 2.25% $51.22 3.71% $67.76 -21.61% $61.58 -13.74%
MCK $141.47 2.20% $143.20 0.96% $144.93 -0.24% $164.80 -12.27%
MEI $40.50 2.47% $42.30 -1.89% $42.11 -1.45% $27.82 49.15%
MET $52.62 -3.23% $50.73 0.38% $53.47 -4.76% $41.60 22.42%
MIDD $141.07 -4.53% $134.18 0.37% $137.33 -1.93% $117.51 14.61%
MNST $47.45 0.36% $44.90 6.06% $43.38 9.77% $49.54 -3.87%
MRK $63.97 -0.63% $62.61 1.53% $65.19 -2.48% $52.27 21.61%
NFLX $156.60 2.69% $142.92 12.52% $140.82 14.20% $87.88 82.99%
NVDA $103.86 23.14% $95.49 33.93% $108.64 17.72% $40.69 214.33%
PCLN $1,903.65 -4.49% $1,738.77 4.57% $1,637.29 11.05% $1,278.64 42.20%
REGN $429.00 3.04% $370.37 19.35% $376.52 17.40% $369.46 19.65%
SAM $146.35 -2.19% $139.05 2.95% $165.20 -13.35% $150.04 -4.59%
SBUX $60.70 -1.27% $57.27 4.64% $56.35 6.36% $54.90 9.17%
STZ $177.99 0.33% $168.46 6.00% $155.44 14.88% $159.78 11.76%
SUI $83.45 0.92% $82.02 2.68% $79.48 5.96% $68.48 22.99%
SWKS $101.18 1.32% $97.20 5.47% $91.55 11.98% $59.92 71.10%
THRM $37.35 2.41% $34.65 10.39% $35.65 7.29% $34.63 10.45%
TMO $171.06 0.27% $152.18 12.71% $157.13 9.16% $147.30 16.44%
TRN $27.12 -0.81% $25.52 5.41% $28.00 -3.92% $16.74 60.72%
UA $19.09 -1.00% $17.76 6.42% $19.41 -2.63% $34.47 -45.16%
ULTA $295.47 0.70% $282.68 5.26% $271.46 9.61% $205.20 45.00%

Week average for Watch List stocks: 0.52% compared to indexes for same period at: -0.01%
Month average for Watch List stocks: 5.22% compared to indexes for same period at: 4.05%
Quarter average for Watch List stocks: 5.39% compared to indexes for same period at: 4.07%
Year average for Watch List stocks: 36.50% compared to indexes for same period at: 23.29%

Short Term Watch List

1 week ago 1 month ago 1 quarter ago 1 year ago
Stock Close Profit % Close Profit % Close Profit % Close Profit
AAPL $148.35 5.23% $140.47 11.13% $134.46 16.09% $88.82 75.75%
ABMD $133.03 -1.21% $124.61 5.47% $108.96 20.61% $94.08 39.69%
ALGN $138.03 0.46% $113.73 21.93% $98.39 40.94% $76.08 82.27%
AMAT $41.83 3.85% $37.52 15.78% $35.13 23.66% $19.34 124.61%
AMZN $934.15 2.91% $884.67 8.67% $836.39 14.94% $709.92 35.42%
AZPN $58.64 -0.46% $58.50 -0.22% $56.16 3.94% $37.25 56.70%
CRUS $63.71 0.42% $61.64 3.80% $53.36 19.90% $31.36 104.02%
DPZ $193.12 1.12% $174.04 12.20% $184.45 5.87% $120.69 61.80%
HDSN $7.10 9.86% $6.51 19.82% $7.72 1.04% $3.53 120.96%
HSKA $91.70 3.85% $101.64 -6.31% $82.47 15.47% $39.56 140.72%
MEI $40.50 2.47% $42.30 -1.89% $42.11 -1.45% $27.82 49.15%
NFLX $156.60 2.69% $142.92 12.52% $140.82 14.20% $87.88 82.99%
NVDA $103.86 23.14% $95.49 33.93% $108.64 17.72% $40.69 214.33%
SUI $83.45 0.92% $82.02 2.68% $79.48 5.96% $68.48 22.99%
ULTA $295.47 0.70% $282.68 5.26% $271.46 9.61% $205.20 45.00%

Week average for Short Term Watch List stocks: 3.73% compared to indexes for same period at: -0.01%
Month average for Short Term Watch List stocks: 9.65% compared to indexes for same period at: 4.05%
Quarter average for Short Term Watch List stocks: 13.90% compared to indexes for same period at: 4.07%
Year average for Short Term Watch List stocks: 83.76% compared to indexes for same period at: 23.29%

Total Execution Time: 129.1390619278 Sec

This information was calculated on May 14, 2017 and is based on the closing value of the most recent trading day which may not be today.
This information is based on the Yahoo Historical Pricing and is only as good or as current as that data.
My Short Term Watch List (including $AZPN) grew by 83.76% over the last year

My Watch List (including $LULU) grew by 36.50% over the last year

My Short Term Watch List (including $NVDA) grew by 83.76% over the last year