The time was when the internet was people on their PCs sending email and surfing web content dished up by servers. Sure, it was around before that in its academic/military guise, but as far as the public consciousness was concerned, PCs, laptops, email and the web, was all the internet meant. A few years ago that changed, imperceptibly at first, such that now the recurrent understanding of the internet is far more diverse, feral even. Myriad devices and people creating content in multiple forms, for consumption on an increasing array of devices. And it’s changing industry too- internet-connected combine harvesters, anyone? It has become known as the internet of things, guided by the fact that if something has an on/off switch, it should probably compute, and if it is going to compute, it should also connect to the internet.

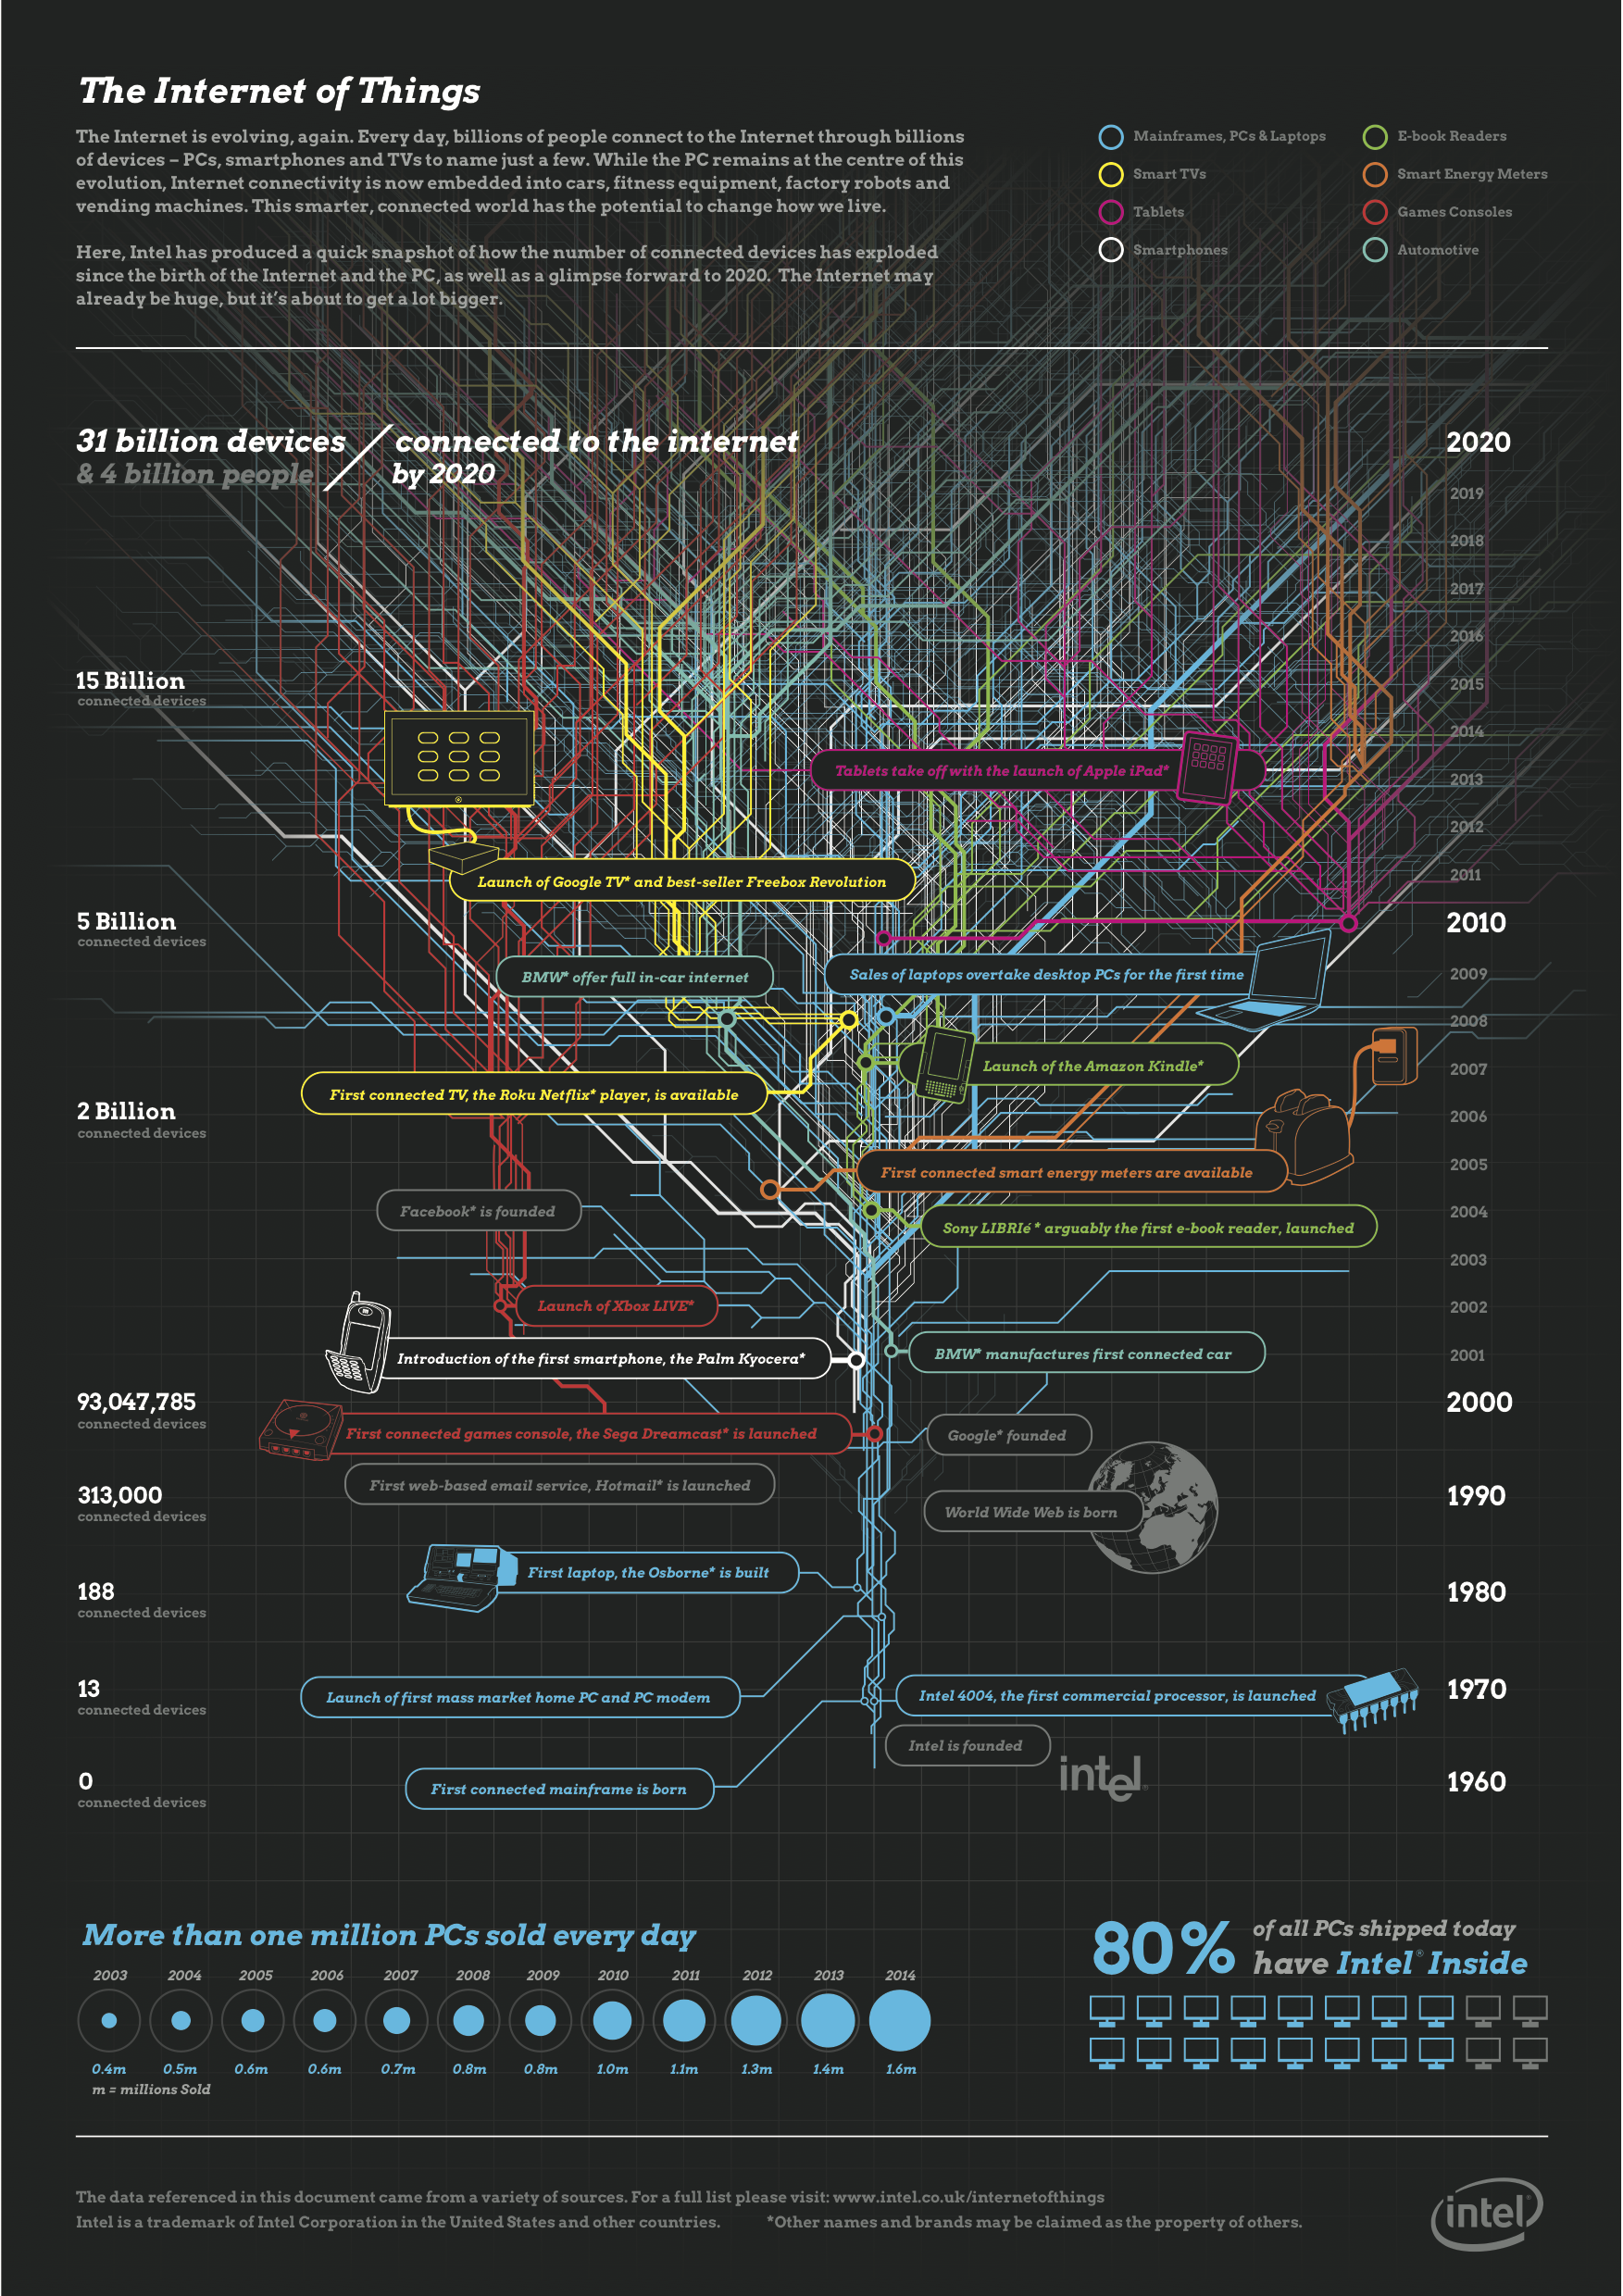
There are roughly 10 billion devices connected to the web today. By 2020, Intel estimates there will be 31 billion devices connected. Here are some other predictions for the IoT in 2020:

  • IDC forecasts the market to be worth $7.1 trillion
  • Cisco has estimated by then, 5 billion people and 50 billion devices will be connected
  • Morgan Stanley feels the number should be even higher: up to 75 billion devices connected in 2020

Regardless of whether it is 30 or 75 billion, that number is still huge – and investors need to stay on top of this development. There is no shortage of opportunities!

Symbol Stock Price change today
LULU lululemon athletica inc. 11.55%
CVCO Cavco Industries Inc. 3.83%
SUI Sun Communities Inc. Common St 3.60%
REGN Regeneron Pharmaceuticals Inc. 3.09%
ALGN Align Technology Inc. 2.60%
HDSN Hudson Technologies Inc. 2.43%
MEI Methode Electronics Inc. Commo 2.33%
UA Under Armour Inc. Class C Comm 1.79%
AMAT Applied Materials Inc. 1.74%
BWLD Buffalo Wild Wings Inc. 1.74%
ULTA Ulta Beauty Inc. 1.55%
AAPL Apple Inc. 1.48%
AZPN Aspen Technology Inc. 1.40%
FB Facebook Inc. 1.37%
NFLX Netflix Inc. 1.34%
SBUX Starbucks Corporation 1.29%
DPZ Domino’s Pizza Inc Common Stock 1.26%
ALXN Alexion Pharmaceuticals Inc. 1.24%
AMZN Amazon.com Inc. 1.08%
MIDD The Middleby Corporation 1.02%
IDXX IDEXX Laboratories Inc. 0.96%
EXR Extra Space Storage Inc Common 0.91%
TMO Thermo Fisher Scientific Inc Co 0.90%
GOOGL Alphabet Inc. 0.79%
TRN Trinity Industries Inc. Common 0.77%
SWKS Skyworks Solutions Inc. 0.69%
MNST Monster Beverage Corporation 0.59%
AYI Acuity Brands Inc (Holding Comp 0.46%
THRM Gentherm Inc 0.39%
ABMD ABIOMED Inc. 0.39%
MRK Merck & Company Inc. Common St 0.32%
PCLN The Priceline Group Inc. 0.27%
EW Edwards Lifesciences Corporatio 0.15%
COF Capital One Financial Corporati 0.15%
GWR Genesee & Wyoming Inc. Class A 0.14%
BABA Alibaba Group Holding Limited A 0.13%
STZ Constellation Brands Inc. Comm 0.04%
HZO MarineMax Inc. (FL) Common St 0.00%
LNCE Snyder’s-Lance Inc. -0.08%
HOG Harley-Davidson Inc. Common St -0.13%
MCK McKesson Corporation Common Sto -0.13%
GTN Gray Communications Systems In -0.40%
MET MetLife Inc. Common Stock -0.43%
NVDA NVIDIA Corporation -0.50%
CBPO China Biologic Products Inc. -0.57%
CRUS Cirrus Logic Inc. -0.74%
SAM Boston Beer Company Inc. (The) -1.34%
HSKA Heska Corporation -1.57%

Symbol Stock Price change today
BWLD Buffalo Wild Wings Inc. 4.21%
THRM Gentherm Inc 3.32%
GTN Gray Communications Systems In 3.32%
UA Under Armour Inc. Class C Comm 3.14%
CRUS Cirrus Logic Inc. 3.08%
HZO MarineMax Inc. (FL) Common St 3.05%
ABMD ABIOMED Inc. 2.60%
ALXN Alexion Pharmaceuticals Inc. 2.60%
LNCE Snyder’s-Lance Inc. 2.56%
AYI Acuity Brands Inc (Holding Comp 2.50%
SAM Boston Beer Company Inc. (The) 2.17%
TRN Trinity Industries Inc. Common 2.16%
MET MetLife Inc. Common Stock 2.12%
EW Edwards Lifesciences Corporatio 2.01%
CVCO Cavco Industries Inc. 1.95%
MCK McKesson Corporation Common Sto 1.91%
MIDD The Middleby Corporation 1.87%
MEI Methode Electronics Inc. Commo 1.74%
DPZ Domino’s Pizza Inc Common Stock 1.71%
AZPN Aspen Technology Inc. 1.67%
REGN Regeneron Pharmaceuticals Inc. 1.52%
COF Capital One Financial Corporati 1.30%
BABA Alibaba Group Holding Limited A 1.23%
SWKS Skyworks Solutions Inc. 1.17%
TMO Thermo Fisher Scientific Inc Co 1.17%
STZ Constellation Brands Inc. Comm 1.06%
CBPO China Biologic Products Inc. 1.00%
HDSN Hudson Technologies Inc. 0.98%
LULU lululemon athletica inc. 0.83%
MNST Monster Beverage Corporation 0.81%
PCLN The Priceline Group Inc. 0.73%
ULTA Ulta Beauty Inc. 0.62%
HOG Harley-Davidson Inc. Common St 0.57%
GWR Genesee & Wyoming Inc. Class A 0.55%
ALGN Align Technology Inc. 0.49%
SUI Sun Communities Inc. Common St 0.34%
AAPL Apple Inc. 0.27%
AMAT Applied Materials Inc. 0.26%
MRK Merck & Company Inc. Common St 0.23%
SBUX Starbucks Corporation 0.22%
AMZN Amazon.com Inc. 0.13%
GOOGL Alphabet Inc. 0.12%
FB Facebook Inc. 0.05%
NVDA NVIDIA Corporation 0.01%
NFLX Netflix Inc. -0.05%
IDXX IDEXX Laboratories Inc. -0.08%
HSKA Heska Corporation -0.53%
EXR Extra Space Storage Inc Common -2.19%


With all other things going on, Amazon.com, Inc. [stckqut]AMZN[/stckqut] has been on a run — rising 17.34 percent in just three months. It looks like traders are happy with the stock. On the other side, analysts now consider Amazon a buy, and a technical analysis of the stock is setting somewhat neutral outlook for now.

Let’s talk about the gap between analyst price targets for the next 12 months and Amazon’s current share price. Normally this spread should be in positive territory, indicating that analysts expect an investment’s value to increase over time.  The median target of analyst views collected by Yahoo Finance was as much as $99.22 below AMZN’s recent stock price. That’s the optimistic view from Wall Street.

The stock has actually made strong gains in the past year, as the company has gathered a 39.29% return in the past twelve months. But even with this move, there is still plenty of room for the company to come back from a longer term perspective, and especially if we look to recent lows for the company as well.

Finally, from a technical perspective, there’s a strong possibility that the stock could enter into a new bull market after finding strong support between $985.16 and $990.47. In terms of pullbacks, $999.87 level is the first resistance point. Technical analysis can help recognize key technical price levels in the stock. Investors can use these support and resistance levels to refine their entries and exits from stocks.

Amazon.com’s price is pointing towards neither exit nor entry barriers, according to the Relative Strength Index (RSI). RSI measures the speed and change of a stock price to warn investors when a stock’s momentum has carried it too far. An RSI reading above 80 indicates that a stock is overbought while anything below 20 is oversold.

The Stochastic %K for Amazon is 94.6. The stochastic oscillator is a momentum indicator comparing the closing price of a security to the range of its prices over a certain period of time. The sensitivity of the oscillator to market movements is reducible by adjusting that time period or by taking a moving average of the result. Considering the most traditional settings for the oscillator, 20 is typically considered the oversold threshold and 80 is considered the overbought threshold. However, the levels are adjustable to fit security characteristics and analytical needs. Readings above 80 indicate a security is trading near the top of its high-low range; readings below 20 indicate the security is trading near the bottom of its high-low range.

14-day Williams %R for Amazon moved to around 5.53. The interpretation of Williams %R is very similar to that of the stochastic oscillator, except that the stochastic oscillator has internal smoothing. The oscillator ranges from 0 to -100. No matter how fast a security advances or declines, Williams %R will always fluctuate within this range. Overbought and oversold levels can be used to identify unsustainable price extremes. Simply put, readings in the range of 80% to 100% indicate that the security is oversold while readings in the 0% to 20% range suggest it is overbought.

Source: Inspecting more closely technicals of Amazon.com, Inc. (AMZN)

Symbol Stock Price change today
HDSN Hudson Technologies Inc. 2.38%
REGN Regeneron Pharmaceuticals Inc. 2.32%
DPZ Domino’s Pizza Inc Common Stock 1.55%
HSKA Heska Corporation 1.55%
ALGN Align Technology Inc. 1.30%
STZ Constellation Brands Inc. Comm 1.24%
PCLN The Priceline Group Inc. 1.06%
MIDD The Middleby Corporation 1.05%
CBPO China Biologic Products Inc. 1.02%
LULU lululemon athletica inc. 0.75%
AMAT Applied Materials Inc. 0.70%
THRM Gentherm Inc 0.67%
ULTA Ulta Beauty Inc. 0.61%
MCK McKesson Corporation Common Sto 0.60%
HZO MarineMax Inc. (FL) Common St 0.56%
SBUX Starbucks Corporation 0.55%
EW Edwards Lifesciences Corporatio 0.41%
EXR Extra Space Storage Inc Common 0.39%
MRK Merck & Company Inc. Common St 0.35%
IDXX IDEXX Laboratories Inc. 0.27%
ALXN Alexion Pharmaceuticals Inc. 0.26%
CRUS Cirrus Logic Inc. 0.14%
AYI Acuity Brands Inc (Holding Comp 0.08%
AZPN Aspen Technology Inc. 0.08%
SWKS Skyworks Solutions Inc. 0.07%
MEI Methode Electronics Inc. Commo 0.00%
HOG Harley-Davidson Inc. Common St 0.00%
SUI Sun Communities Inc. Common St -0.03%
LNCE Snyder’s-Lance Inc. -0.03%
NFLX Netflix Inc. -0.09%
AMZN Amazon.com Inc. -0.21%
MET MetLife Inc. Common Stock -0.22%
TMO Thermo Fisher Scientific Inc Co -0.27%
MNST Monster Beverage Corporation -0.30%
NVDA NVIDIA Corporation -0.36%
TRN Trinity Industries Inc. Common -0.55%
AAPL Apple Inc. -0.59%
SAM Boston Beer Company Inc. (The) -0.59%
FB Facebook Inc. -0.60%
BWLD Buffalo Wild Wings Inc. -0.90%
GOOGL Alphabet Inc. -0.91%
UA Under Armour Inc. Class C Comm -1.00%
CVCO Cavco Industries Inc. -1.08%
BABA Alibaba Group Holding Limited A -1.17%
GWR Genesee & Wyoming Inc. Class A -1.40%
GTN Gray Communications Systems In -1.63%
ABMD ABIOMED Inc. -1.64%
COF Capital One Financial Corporati -1.74%