KBR, Inc. ($KBR) Confident Investor Rating: Poor
![]()
| Company name | KBR, Inc. |
| Stock ticker | KBR |
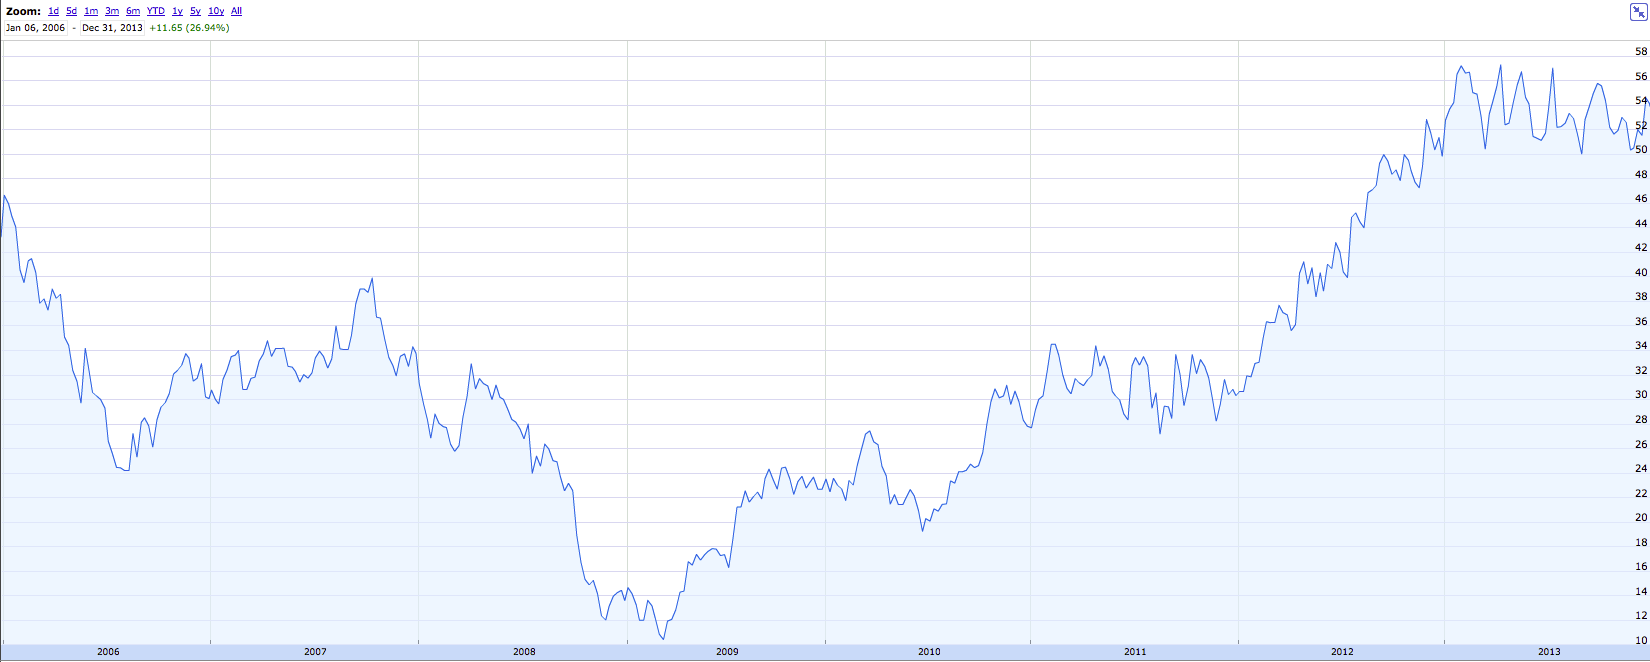
| Live stock price | [stckqut]KBR[/stckqut] |
| P/E compared to competitors | Good |
MANAGEMENT EXECUTION
| Employee productivity | Fair |
| Sales growth | Poor |
| EPS growth | Poor |
| P/E growth | Good |
| EBIT growth | Poor |
ANALYSIS
| Confident Investor Rating | Poor |
| Target stock price (TWCA growth scenario) | $31.65 |
| Target stock price (averages with growth) | $43.73 |
| Target stock price (averages with no growth) | $41.49 |
| Target stock price (manual assumptions) | $32.64 |
The following company description is from Google Finance: http://www.google.com/finance?q=kbr
KBR, Inc. (KBR) is a global engineering, construction and services company supporting the energy, hydrocarbons, Government services, minerals, civil infrastructure, power, industrial and commercial markets. The Company operates in four segments: Hydrocarbons, Infrastructure, Government and Power (IGP), Services, and Other. As of December 31, 2011, the Company conducted its business in over 70 countries.
Confident Investor comments: At this price and at this time, I do not think that a Confident Investor can confidently invest in KBR, Inc.
If you would like to understand how to evaluate companies like I do on this site, please read my book, The Confident Investor.
For owners of my book, “The Confident Investor” I offer the following analysis (you must be logged in to this site as a book owner in order to see the following analysis). If you have registered and cannot see the balance of this article, make sure you are logged in and refresh your browser.
[s2If current_user_can(s2member_level1)]
In order to assist you in using the techniques of this book, the values that I used when calculating the Manual pricing above were:
Stock price at the time of the calculation: $30.84
Growth: 0.11
Current EPS (TTM): $1.56
P/E: 20
Future EPS Calc: $2.62
Future Stock Price Calc: $52.57
Target stock price: $32.64
I hope that this makes you a better investor. [/s2If]