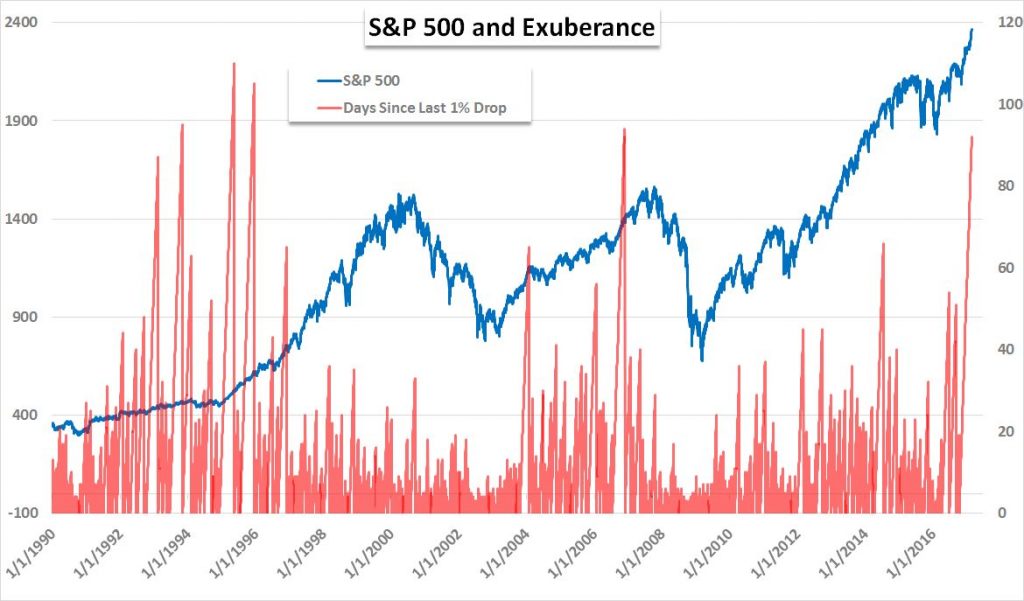
As John Kicklighter points out on Stocktwits (https://stocktwits.com/johnkicklighter), we have now have had 92 straight trading days since the S&P500 has had a 1% loss.

The gains also have been broad-based, with sectors such as financials, consumer goods, technology, and healthcare all advancing. At least four major factors are helping drive prices higher: rising corporate earnings, global economic growth, continued low-interest rates and expectations that President Trump’s call for tax and regulatory cuts could further swell earnings.

It’s worth keeping historical data in your decision-making arsenal. The average bull-market length is 54 months, according to J.P. Morgan Asset Management—42 months shorter than the current bull run through February. And the S&P 500 long-term average price/earnings ratio? It’s just 15, compared with more than 25 today. That kind of wider context signals that today’s valuations and recent good times won’t be easy to sustain.

Source: johnkicklighter – Now 92 trading days since we had a 1% or greater loss from t… | StockTwits

One of the biggest challenges in investing in the stock market is picking the best stocks. In my book, “The Confident Investor” I teach my readers how to pick Good Companies. This page is designed to show the raw performance of these companies. It is not designed to show my personal portfolio, which may or may not exceed the performance stated here. Since I use the trading system described in my book, you can assume that I beat the performance recorded here.

I have created three tables below. The first table is the general market – NASDAQ and S&P500. Every investor should try to beat the average of these two indexes. In this report, my larger Watch List beats this metric easily.

I must caution you, I do not actually propose that you “buy and hold” any given stock, but rather you should “buy to hold” the stock. My investing technique teaches you to efficiently move your money to the stocks that are currently increasing in value the most. I use my Watch List for this work, these are Good Companies that I wait for great buying opportunities. This strategy is well described in my book, “The Confident Investor” and tends to be a very safe strategy in bear markets while typically still providing above market returns in a bull or flat market.

My Short Term Watch List are 15 companies that are hot right now. I select this list every quarter. I evenly divide a portion of my portfolio among these 15 companies. The next quarter, I add or delete companies as necessary and then re-balance the portfolio. This tends to be a more risky strategy because I don’t bail out on bad stock movement (at least until the end of the quarter). In a bull market or a flat market, these very well-run and high-performing companies tend to beat the general market by a significant margin.

BL-TCI-cover

You can purchase my book wherever books are sold such as Amazon, Barnes and Noble, and Books A Million. It is available in paperback as well as e-book formats for Nook, Kindle, and iPad.

Stock Indexes Performance

1 week ago 1 month ago 1 quarter ago 1 year ago
Index Close Profit % Close Profit % Close Profit % Close Profit
^GSPC $2,351.16 0.69% $2,296.68 3.08% $2,213.35 6.96% $1,948.05 21.52%
^IXIC $5,838.58 0.12% $5,655.18 3.36% $5,398.92 8.27% $4,590.47 27.34%

Week average for Indexes: 0.40%
Month average for Indexes: 3.22%
Quarter average for Indexes: 7.61%
Year average for Indexes: 24.43%

Watch List Performance

1 week ago 1 month ago 1 quarter ago 1 year ago
Stock Close Profit % Close Profit % Close Profit % Close Profit
AAPL $135.72 0.69% $121.41 12.56% $111.31 22.78% $94.90 44.00%
ABMD $116.57 0.49% $106.09 10.42% $113.67 3.05% $80.65 45.24%
ALGN $101.77 1.10% $92.23 11.56% $96.19 6.97% $65.40 57.32%
ALXN $128.82 2.11% $128.20 2.61% $118.83 10.70% $140.16 -6.15%
AMAT $35.67 1.77% $33.88 7.13% $31.79 14.19% $18.74 93.72%
AMZN $845.07 0.02% $839.15 0.73% $780.37 8.31% $555.23 52.23%
AYI $220.29 -0.98% $212.02 2.88% $257.37 -15.25% $208.29 4.73%
AZPN $57.06 2.30% $56.09 4.06% $52.89 10.36% $32.99 76.93%
BABA $100.52 2.42% $102.75 0.19% $93.01 10.69% $66.91 53.86%
BWLD $159.05 -3.68% $156.75 -2.26% $170.55 -10.17% $157.37 -2.65%
CBPO $110.14 -0.94% $114.03 -4.32% $119.92 -9.02% $116.18 -6.09%
COF $91.81 0.87% $89.30 3.71% $84.18 10.01% $65.75 40.85%
CRUS $55.33 0.60% $60.34 -7.76% $57.47 -3.15% $35.12 58.49%
CVCO $114.50 0.70% $100.40 14.84% $95.35 20.92% $81.92 40.75%
DPZ $187.93 -0.88% $170.94 8.97% $171.86 8.39% $132.95 40.11%
EW $89.74 5.59% $95.13 -0.39% $85.80 10.44% $87.93 7.77%
EXR $77.25 2.90% $73.98 7.45% $69.34 14.65% $80.13 -0.80%
FB $133.53 1.43% $132.78 2.00% $120.38 12.51% $107.92 25.50%
GOOGL $846.55 0.15% $856.98 -1.07% $780.23 8.66% $724.86 16.96%
GTN $12.55 6.37% $11.55 15.58% $9.85 35.53% $11.75 13.62%
GWR $75.39 -1.43% $77.19 -3.73% $76.96 -3.44% $57.12 30.09%
HDSN $7.73 -7.37% $7.58 -5.54% $8.18 -12.47% $3.23 121.67%
HOG $56.93 -0.65% $59.80 -5.41% $59.43 -4.84% $42.23 33.92%
HSKA $83.06 -2.02% $76.97 5.73% $66.32 22.71% $32.67 149.10%
HZO $22.70 0.00% $20.10 12.94% $18.60 22.04% $17.30 31.21%
LNCE $38.84 2.11% $38.17 3.90% $37.71 5.16% $31.76 24.89%
LULU $66.73 -2.11% $67.64 -3.43% $57.99 12.64% $61.56 6.11%
MCK $150.25 0.40% $138.55 8.88% $142.79 5.64% $156.00 -3.30%
MEI $42.20 0.00% $42.20 0.00% $38.07 10.86% $28.10 50.17%
MET $52.97 -0.91% $55.62 -5.62% $55.04 -4.64% $38.73 35.51%
MIDD $138.21 0.61% $135.92 2.30% $139.21 -0.11% $90.56 53.54%
MNST $43.63 -0.18% $42.67 2.06% $44.85 -2.90% $43.60 -0.11%
MRK $65.39 1.18% $61.20 8.10% $61.74 7.17% $49.06 34.87%
NFLX $142.22 0.72% $138.96 3.09% $117.41 22.01% $94.79 51.12%
NVDA $107.09 -5.26% $109.51 -7.35% $94.04 7.89% $31.34 223.75%
PCLN $1,637.40 -0.35% $1,581.44 3.17% $1,521.68 7.22% $1,254.27 30.09%
REGN $371.18 -2.74% $340.75 5.95% $398.16 -9.33% $394.23 -8.43%
SAM $169.75 -6.22% $154.85 2.81% $174.90 -8.98% $188.95 -15.74%
SBUX $57.35 0.23% $58.20 -1.23% $57.17 0.54% $57.41 0.12%
STZ $161.32 -1.53% $149.57 6.20% $156.00 1.83% $140.62 12.97%
SUI $80.93 3.20% $78.74 6.07% $71.33 17.10% $65.69 27.15%
SWKS $96.35 -1.71% $90.74 4.37% $76.78 23.34% $63.93 48.13%
THRM $35.70 2.38% $34.90 4.73% $31.70 15.30% $41.65 -12.24%
TMO $158.64 0.21% $143.10 11.10% $144.03 10.38% $130.17 22.13%
TRN $28.84 -5.17% $28.54 -4.17% $27.26 0.32% $15.54 75.98%
UA $19.75 0.41% $25.50 -22.24% $24.14 -17.85% $0.00 0.00%
ULTA $275.15 0.43% $272.42 1.44% $263.62 4.82% $164.75 67.73%

Week average for Watch List stocks: -0.06% compared to indexes for same period at: 0.40%
Month average for Watch List stocks: 2.62% compared to indexes for same period at: 3.22%
Quarter average for Watch List stocks: 6.45% compared to indexes for same period at: 7.61%
Year average for Watch List stocks: 37.17% compared to indexes for same period at: 24.43%

Short Term Watch List

1 week ago 1 month ago 1 quarter ago 1 year ago
Stock Close Profit % Close Profit % Close Profit % Close Profit
ABMD $116.57 0.49% $106.09 10.42% $113.67 3.05% $80.65 45.24%
ALGN $101.77 1.10% $92.23 11.56% $96.19 6.97% $65.40 57.32%
AMAT $35.67 1.77% $33.88 7.13% $31.79 14.19% $18.74 93.72%
AMZN $845.07 0.02% $839.15 0.73% $780.37 8.31% $555.23 52.23%
AYI $220.29 -0.98% $212.02 2.88% $257.37 -15.25% $208.29 4.73%
CBPO $110.14 -0.94% $114.03 -4.32% $119.92 -9.02% $116.18 -6.09%
CRUS $55.33 0.60% $60.34 -7.76% $57.47 -3.15% $35.12 58.49%
DPZ $187.93 -0.88% $170.94 8.97% $171.86 8.39% $132.95 40.11%
EW $89.74 5.59% $95.13 -0.39% $85.80 10.44% $87.93 7.77%
HDSN $7.73 -7.37% $7.58 -5.54% $8.18 -12.47% $3.23 121.67%
HSKA $83.06 -2.02% $76.97 5.73% $66.32 22.71% $32.67 149.10%
NVDA $107.09 -5.26% $109.51 -7.35% $94.04 7.89% $31.34 223.75%
STZ $161.32 -1.53% $149.57 6.20% $156.00 1.83% $140.62 12.97%
SUI $80.93 3.20% $78.74 6.07% $71.33 17.10% $65.69 27.15%
ULTA $275.15 0.43% $272.42 1.44% $263.62 4.82% $164.75 67.73%

Week average for Short Term Watch List stocks: -0.39% compared to indexes for same period at: 0.40%
Month average for Short Term Watch List stocks: 2.38% compared to indexes for same period at: 3.22%
Quarter average for Short Term Watch List stocks: 4.39% compared to indexes for same period at: 7.61%
Year average for Short Term Watch List stocks: 63.72% compared to indexes for same period at: 24.43%

Total Execution Time: 52.004050970078 Sec

This information was calculated on Feb 26, 2017 and is based on the closing value of the most recent trading day which may not be today.
This information is based on the Yahoo Historical Pricing and is only as good or as current as that data.
My Short Term Watch List (including $ABMD) grew by 63.72% over the last year

My Watch List (including $ULTA) grew by 37.17% over the last year

My Short Term Watch List (including $AMZN) grew by 63.72% over the last year

Americans aren’t saving enough for retirement.

True, this has been a refrain for longer than many can remember. But now some disturbing numbers show exactly how bad it’s gotten. Two-thirds of all Americans don’t contribute anything to a 401(k) or other retirement account available through their employer.

Millions aren’t saving on the job because they either don’t have access to a workplace retirement plan or they do but aren’t putting money in it. Many just can’t spare the cash, but a new analysis shows there are other reasons, too.

Until now, the exact size of the problem has been unclear. Surveys can be unreliable: Small businesses are difficult to assess, and many workers just don’t know what plan options they have, especially if employers aren’t making much effort to sign them up. Information on a 401(k) may be part of a stack of paper handed out on their first day, that they don’t read or understand, and ultimately set aside and never think about again.

Now, U.S. Census Bureau researchers have come up with estimates that rely on tax data, which should be more reliable than surveys. Their conclusion: Only about a third of workers are saving in a 401(k) or similar tax-deferred retirement plan. Also, the gap is far wider than expected between the number of employers offering retirement plans, and the number of workers saving in them.

Source: Two-Thirds of Americans Aren’t Putting Money in Their 401(k) – Bloomberg

The Applied Materials, Inc. [stckqut]AMAT[/stckqut] stock chart is littered with bullish indicators that suggest higher prices are likely for Applied Materials stock.

The bullish run in Applied Materials, Inc. stock, which began in August 2015, has been nothing short of spectacular. In that time span, AMAT stock has managed a whopping return of 160% for those savvy enough to pick up shares as the price put in a bottom.

Patrick Brik of Profit Confidential believes that this bullish run in Applied Materials stock still has legs, and that higher prices are still likely.

Patrick is bullish on AMAT stock because all the indications on multiple time frames continue to suggest that higher Applied Materials stock prices are likely. He believes that the current surge toward higher prices will continue until the previous all-time high, which was set at the peak of the dot-com bubble, is tested.

Source: Applied Materials Stock (NASDAQ:AMAT) Still Has Plenty of Room to Run

[s2If !current_user_can(access_s2member_level1)]This information is exclusively for the registered owners of my book, “The Confident Investor” and will not be visible to other visitors to this site (you must be logged in to this site as a book owner in order to see the following analysis).

If you have registered and cannot see the technical indicators on each stock of my Watch List below, make sure you are logged in and refresh your browser.

As an example of the success that my book teaches, in a 7 year time frame from January 3, 2006 to December 31, 2012, Decker Corporation increased 304.7% if you would have implemented a pure buy-and-hold strategy. If you would implemented the strategy that I explain in my book, The Confident Investor, you would have seen a 371.2% return on your investment. This is a 21.8% increase on the profit percentage.

Can your investment system beat the market by that much?

BL-TCI-cover

You can purchase my book wherever books are sold such as AmazonBarnes and Noble, and Books A Million. It is available in paperback as well as e-book formats for NookKindle, and iPad

[/s2If]

[s2If current_user_can(access_s2member_level1)]Thank you for being a registered book owner. Please remember that the below indicators should NOT be considered signals for you to invest in or sell any of these stocks. Rather, you should double check all analysis and understand that the decision to invest in or sell one of these stocks is purely your own. This information is purely provided for educational purposes.

Read More →