[s2If !current_user_can(access_s2member_level1)]This information is exclusively for the registered owners of my book, “The Confident Investor” and will not be visible to other visitors to this site (you must be logged in to this site as a book owner in order to see the following analysis).

If you have registered and cannot see the technical indicators on each stock of my Watch List below, make sure you are logged in and refresh your browser.

As an example of the success that my book teaches, in a 7 year time frame from January 3, 2006 to December 31, 2012, Decker Corporation increased 304.7% if you would have implemented a pure buy-and-hold strategy. If you would implemented the strategy that I explain in my book, The Confident Investor, you would have seen a 371.2% return on your investment. This is a 21.8% increase on the profit percentage.

Can your investment system beat the market by that much?

BL-TCI-cover

You can purchase my book wherever books are sold such as AmazonBarnes and Noble, and Books A Million. It is available in paperback as well as e-book formats for NookKindle, and iPad

[/s2If]

[s2If current_user_can(access_s2member_level1)]Thank you for being a registered book owner. Please remember that the below indicators should NOT be considered signals for you to invest in or sell any of these stocks. Rather, you should double check all analysis and understand that the decision to invest in or sell one of these stocks is purely your own. This information is purely provided for educational purposes.

Read More →

Are you questioning if you should “cut the cord” on your cable bill?

Since 2008, the average number of channels in U.S. cable bundles has grown from 129 to 199. But people typically watch only about 15 a week, according to Nielsen.

If you are really only watching 15 channels, would it be possible for you to get that same content for a cheaper price by not paying your cable company? One option may be an antenna. Another option could be SlingTV (or some of its competitors).

Sling TV is an American over-the-top internet television service that is owned by the Blockbuster LLC subsidiary of Dish Network. Unveiled on January 5, 2015, at the Consumer Electronics Show, the service aims to complement subscription video on demand services for cord cutters, offering a selection of major cable channels that can be streamed through smart TVs, digital media players and apps. At the time of this writing, you could get 50 channels for about $40. You would probably need an antenna to get your local stations, but those are available from Amazon for a one-time charge of $20-40.

Many networks get small audiences. Nearly 70 channels that collect an average of $13 of Americans’ monthly cable bills each accounted for about 0.5% or less of total TV viewing in January, according to a WSJ analysis of Nielsen and Kagan data.

Small channels get the least revenue from monthly bills, but they have still been profitable—one reason it has been hard for media conglomerates to shutter them. Viacom’s BET Soul, a channel so small that Nielsen doesn’t provide its ratings, ranked third out of all U.S. networks with a 58% cash flow margin last year on $18 million in adjusted operating income, according to Kagan. Small channels are able to turn profits thanks to little to no staffing and tiny content costs that amount to a fraction of the cable carriage fees and ad revenue they rake in.

Some networks may be off limits because they are so profitable. Viacom’s TV Land, which airs reruns of “Roseanne” and other shows, and VH1 together earned nearly $450 million in adjusted operating income last year, more than Netflix’s haul of $437 million, according to Kagan and its parent, S&P Global Market Intelligence.

Still, changes in the landscape are forcing media companies into tough decisions. As consumers downgrade from big cable packages to skinny bundles, undersized networks like Time Warner Inc.’s Boomerang, Discovery’s American Heroes Channel and A+E Networks’ FYI are the ones losing the most household subscribers, according to Nielsen data. Since they get paid carriage fees on a per-subscriber basis, that is a direct financial hit.

Source: Small Cable Channels You Pay for—but Don’t Watch—Are Dying – WSJ

[s2If !current_user_can(access_s2member_level1)]This information is exclusively for the registered owners of my book, “The Confident Investor” and will not be visible to other visitors to this site (you must be logged in to this site as a book owner in order to see the following analysis).

If you have registered and cannot see the technical indicators on each stock of my Watch List below, make sure you are logged in and refresh your browser.

As an example of the success that my book teaches, in a 7 year time frame from January 3, 2006 to December 31, 2012, Decker Corporation increased 304.7% if you would have implemented a pure buy-and-hold strategy. If you would implemented the strategy that I explain in my book, The Confident Investor, you would have seen a 371.2% return on your investment. This is a 21.8% increase on the profit percentage.

Can your investment system beat the market by that much?

BL-TCI-cover

You can purchase my book wherever books are sold such as AmazonBarnes and Noble, and Books A Million. It is available in paperback as well as e-book formats for NookKindle, and iPad

[/s2If]

[s2If current_user_can(access_s2member_level1)]Thank you for being a registered book owner. Please remember that the below indicators should NOT be considered signals for you to invest in or sell any of these stocks. Rather, you should double check all analysis and understand that the decision to invest in or sell one of these stocks is purely your own. This information is purely provided for educational purposes.
Read More →

Symbol Stock Price change today
LULU lululemon athletica inc. 4.11%
REGN Regeneron Pharmaceuticals Inc. 3.03%
AYI Acuity Brands Inc (Holding Comp 2.43%
AMZN Amazon.com Inc. 2.14%
UA Under Armour Inc. Class C Comm 1.89%
ALXN Alexion Pharmaceuticals Inc. 1.85%
BABA Alibaba Group Holding Limited A 1.59%
MEI Methode Electronics Inc. Commo 1.46%
GOOGL Alphabet Inc. 1.10%
THRM Gentherm Inc 1.07%
MCK McKesson Corporation Common Sto 0.98%
AZPN Aspen Technology Inc. 0.95%
HZO MarineMax Inc. (FL) Common St 0.92%
GWR Genesee & Wyoming Inc. Class A 0.90%
NFLX Netflix Inc. 0.90%
CBPO China Biologic Products Inc. 0.78%
STZ Constellation Brands Inc. Comm 0.78%
LNCE Snyder’s-Lance Inc. 0.70%
BWLD Buffalo Wild Wings Inc. 0.65%
FB Facebook Inc. 0.63%
COF Capital One Financial Corporati 0.61%
MNST Monster Beverage Corporation 0.51%
MRK Merck & Company Inc. Common St 0.47%
SAM Boston Beer Company Inc. (The) 0.38%
SBUX Starbucks Corporation 0.33%
SUI Sun Communities Inc. Common St 0.30%
ALGN Align Technology Inc. 0.29%
AAPL Apple Inc. 0.22%
ULTA Ulta Beauty Inc. 0.20%
MIDD The Middleby Corporation 0.19%
AMAT Applied Materials Inc. 0.13%
EW Edwards Lifesciences Corporatio 0.00%
HSKA Heska Corporation 0.00%
TRN Trinity Industries Inc. Common 0.00%
ABMD ABIOMED Inc. -0.14%
HOG Harley-Davidson Inc. Common St -0.15%
PCLN The Priceline Group Inc. -0.19%
NVDA NVIDIA Corporation -0.33%
TMO Thermo Fisher Scientific Inc Co -0.43%
MET MetLife Inc. Common Stock -0.57%
SWKS Skyworks Solutions Inc. -0.71%
CVCO Cavco Industries Inc. -0.73%
EXR Extra Space Storage Inc Common -0.94%
GTN Gray Communications Systems In -1.08%
DPZ Domino’s Pizza Inc Common Stock -1.17%
CRUS Cirrus Logic Inc. -1.43%
HDSN Hudson Technologies Inc. -2.17%


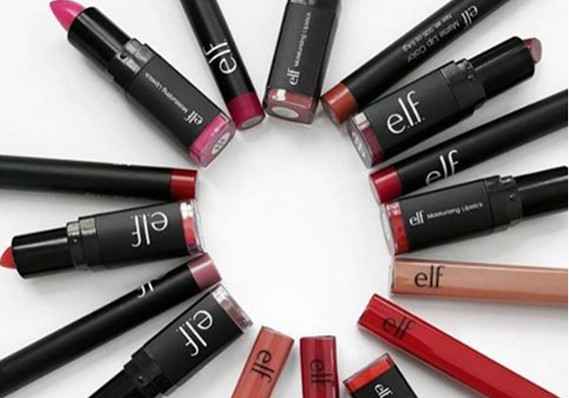
The retail industry may be distressed, but consumers still want to look their best judging by the results from beauty company Ulta Beauty Inc.

Retailers, especially apparel retailers, are facing challenges from changing consumer behavior, including the shift to e-commerce. But beauty products are moving off shelves, both in stores and online.

Ulta has been on my investment Watch List for a long time and I have acquired a significant number of “free” shares in the company due to my investment strategy.

Check out this chart on how it has done compared to the S&P 500.

[graphiq id=”IiZ3qL5o45″ title=”Ulta Salon, Cosmetics & Fragrance, Inc. (ULTA) vs. S&P 500 – Stock Price Percent Change Over Time – 1 Year” width=”550″ height=”400″ url=”https://sw.graphiq.com/w/IiZ3qL5o45″]

If you are interested in how I acquired “free shares” then you should read my book. You can purchase my book wherever books are sold such as Amazon, Barnes and Noble, and Books A Million. It is available in e-book formats for Nook, Kindle, and iPad.

Source: Beauty companies Ulta and E.l.f. are looking good even as retail struggles – MarketWatch