My efforts to find great companies is primarily based on analyzing the fundamentals of each company. It is almost impossible for the average investor to directly understand the effectiveness of a company’s IT spending. Luckily, we don’t have to because that effectiveness should result in growing revenue and growing profitability (which we can directly monitor).

As you read the annual reports of companies though, an important consideration is the CEO’s comments about how IT investment is helping the company. If you fail to see this line of commentary, it should be a red flag for you. Conversely, a strong emphasis by the executives on IT spend that offers competitive advantage should at least be a signal to you to continue watching the company’s performance.

From the cited WSJ article (article may be behind a paywall):

The secret of success for Amazon, Google and Microsoft is how much they invest in their own technology.

New data suggests that the secret of the success of the Amazons, Googles and Facebook s of the world—not to mention the Walmart s, CVSes and UPSes before them—is how much they invest in their own technology. IT spending that goes into hiring developers and creating software owned and used exclusively by a firm is the key competitive advantage. It’s different from our standard understanding of R&D in that this software is used solely by the company, and isn’t part of products developed for its customers.

Source: Why Do the Biggest Companies Keep Getting Bigger? It’s How They Spend on Tech

Largest Companies by Revenue in Each State 2015


Thank you to Broadviewnet for putting out this infographic.  Here is the data:

State 2014 Company 2014 Revenue (Billion) 2015 Company 2015 Revenue (Billion) Headquarters
AL Regions Bank $5.89 Regions Bank $5.40 Birmingham AL
AK Alaska Permanent Fund Corporation $4.44 GCI Inc. $0.91 Anchorage AK
AZ Avnet Inc. $25.45 Avnet Inc. $27.49 Phoenix AZ
AR Wal-Mart Stores $476.29 Wal-Mart Stores $485.65 Bentonville AR
CA Chevron Corporation $228.84 Chevron Corporation $211.97 Sam Ramon CA
CO Arrow Electronics Inc. $21.35 Arrow Electronics Inc. $22.78 Inverness CO
CT General Electric $146.04 General Electric $148.58 Fairfield CT
DE E.I du Pont de Nemours and Company $36.14 E.I du Pont de Nemours and Company $36.04 Wilmington DE
FL World Fuel Services $41.56 World Fuel Services $43.38 Miami FL
GA Home Depot International Inc. $85.53 Home Depot International Inc. $85.90 Atlanta GA
HI Hawaiian Electric Industries Inc. $3.23 Hawaiian Electric Industries Inc. $3.23 Honolulu HI
ID Micro Technology Inc. $9.07 Albertson’s LLC. $23.56 Boise ID
IL Archer Daniels Midland $89.80 The Boeing Company $90.76 Chicago IL
IN WellPoint $71.02 Anthem Inc. $73.87 Indianapolis IN
IA Transamerica Life Insurance Company $19.04 Transamerica Life Insurance Company $23.34 Cedar Rapids IA
KS Sprint Communications Inc. $34.56 Koch Industries $115.00 Wichita KS
KY Humana Inc. $42.31 Humana Inc. $48.50 Louisville KY
LA CenturyLink Inc. $18.09 CenturyLink Inc. $18.03 Monroe LA
ME Hannaford Bros. Co. $3.98 Hannaford Bros. Co. $4.41 Scarborough ME
MD Lockheed Martin $45.35 Lockheed Martin $45.60 Bethesda MD
MA Liberty Mutual Holding Company Inc. $38.50 Liberty Mutual Holding Company Inc. $36.94 Boston MA
MI General Motors $155.42 General Motors $155.92 Detroit MI
MN Cargill Inc. $136.65 UnitedHealth Group $130.47 Minnetonka MN
MS Sanderson Farms Inc. $2.68 Koch Foods Incorporated $2.80 Flowood MS
MO Express Scripts Holding $104.09 Express Scripts Holding $100.88 St. Louis MO
MT Stillwater Mining Company $1.03 Stillwater Mining Company $0.94 Billings MT
NE Berkshire Hathaway $182.15 Berkshire Hathaway $194.67 Omaha NE
NV Las Vegas Sands Corp. $13.76 Las Vegas Sands Corp. $14.58 Paradise NV
NH Sprague Resources LP $4.60 C&S Wholesale Grocers Inc. $21.70 Keene NH
NJ Johnson & Johnson $71.31 Johnson & Johnson $74.33 New Brunswick NJ
NM Presbyterian Healthcare Services $4.60 Presbyterian Healthcare Services $2.05 Albuquerque NM
NY Verizon Communications $120.55 Verizon Communications $127.07 New York NY
NC Bank of America $101.69 Bank of America $95.18 Charlotte NC
ND MDU Resources Group Inc. $4.46 MDU Resources Group Inc. $4.67 Bismarck ND
OH Cardinal Health $101.09 The Kroger Co. $108.46 Cincinnati OH
OK Love’s Travel Stops & Country Stores Inc. $26.09 Love’s Travel Stops & Country Stores Inc. $26.09 Oklahoma City OK
OR Nike Inc. $25.31 Nike Inc. $27.79 Beaverton OR
PA AmeriSourceBergen $87.95 AmeriSourceBergen $119.56 Chesterbrook PA
RI CVS Caremark $126.76 CVS Caremark $139.36 Woonsocket RI
SC Sonoco Products Company $4.48 Sonoco Products Company $5.01 Hartsville SC
SD Sanford Health $3.10 Poet LLC. $6.00 Sioux Falls SD
TN FedEx Corporation $44.28 FedEx Corporation $45.46 Memphis TN
TX Exxon Mobil $438.25 Exxon Mobil $411.93 Irving TX
UT Huntsman Corporation $11.07 Huntsman Corporation $11.57 Salt Lake City UT
VT Keurig Green Mountain Inc. $4.35 Keurig Green Mountain Inc. $4.70 Waterbury VT
VA Freddie Mac $81.22 The Long & Foster Companies Inc. $42.70 Chantilly VA
WA CostCo Wholesale $105.15 CostCo Wholesale $112.64 Issaquah WA
WV West Virginia University Hospitals Inc. $1.38 Mylan Pharmaceuticals Inc. $1.24 Morgantown WV
WI Johnson Controls Inc. $42.73 Johnson Controls Inc. $42.82 Milwaukee WI
WY Cloud Peak Energy Inc. $1.39 Cloud Peak Energy Inc. $1.39 Gillette WY


Holiday shopping isn’t what it used to be.

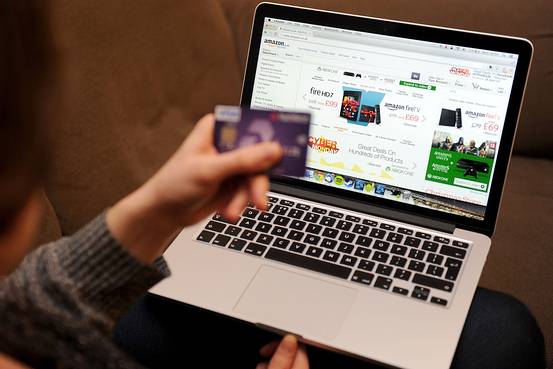
A National Retail Federation survey on Sunday found that more people shopped online than in stores during the Thanksgiving and Black Friday weekend, a sign of how quickly and deeply American shopping habits have changed.

This year, crowds at malls were thinner and stores were calmer over the Black Friday weekend. But online shopping, especially on mobile phones, surged as more retailers offered the same promotions online, often before items became available in stores and shoppers relished the joy of grabbing a deal while lounging at home.

Consumers spent an estimated $4.45 billion online Thursday and Friday, with Black Friday sales rising 14% from a year ago, according to Adobe Systems Inc., [stckqut]ADBE[/stckqut] which tracks purchases across 4,500 U.S. sites. It estimated that more than half of Black Friday shopping came from mobile devices. At Wal-Mart Stores Inc. [stckqut]WMT[/stckqut] about half of online orders since Thanksgiving have been placed on mobile devices, almost double the amount last year, according to the retail chain.

Source: Online Shopping Tops Stores on Black Friday Weekend

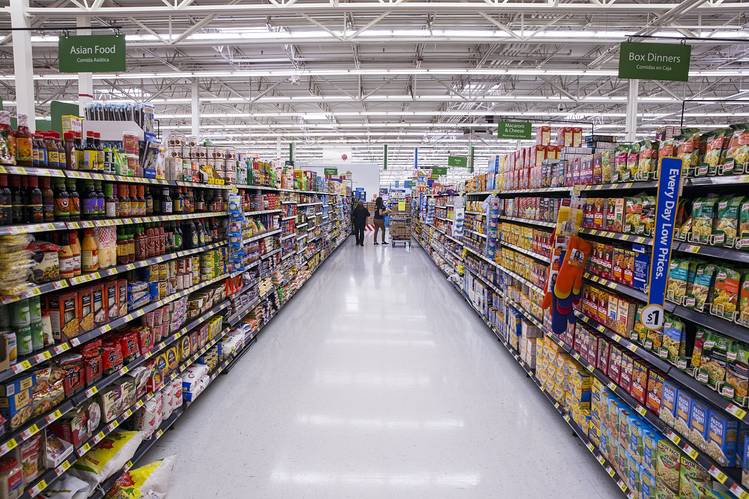
Wal-Mart Stores Inc. [stckqut]WMT[/stckqut] has long set the standard for efficient supply chain operations that help the company squeeze costs so it can offer continuous discounts to customers. But the formidable capabilities the giant used to dominate traditional brick and mortar rivals will not do for e-commerce.

Amazon.com Inc. [stckqut]AMZN[/stckqut], digital from its start in 1994, has buried many traditional retailers online. Wal-Mart, determined to avoid a similar fate, has poured billions of dollars into a digital transformation singular not only for its size and scope — 15 acquisitions and 3,600 new hires – but also for the way its new Silicon Valley epicenter has upended Wal-Mart’s historic approach to technology.

The heart: A massive overhaul project begun in 2012 and named Pangaea, for the prehistoric supercontinent that broke apart to rearrange world geography. For Jeremy King, the diehard engineer who is chief technology officer of Wal-Mart’s global e-commerce operation, Pangaea was a chance to rearrange the world’s biggest company. Mr. King’s team has remade everything from how Wal-Mart’s website works and looks to underlying transaction software, databases and servers, and the backend data center tools to manage it all. Wal-Mart built new cloud infrastructure and data centers and wrote its own search engine in its all-out effort to develop the technological wherewithal to compete with Amazon.

“Pangaea replaces everything,” says Mr. King, in an interview. “My peers, they think I’m out of my mind. Most people don’t replace entire systems in one shot, especially with from-scratch development,” he says. “But given how rapidly this place is changing, we didn’t have time to screw around.”

Source: Wal-Mart Revamps E-Commerce Technology as Amazon Applies Pressure

I recently came across this list on Forbes on the largest 25 tax payers. Forbes does a bit of analysis on each of them. It is probably worth your time to jump over, but I thought I would give the highlights here:


Rank of tax expense

Company

Symbol

Effective Tax Rate

1 ExxonMobil XOM 39%
2 Chevron Corporation CVX 43%
3 Apple Inc. AAPL 25%
4 Wells Fargo & Co. WFC 31.2%
5 JP Morgan Chase & Co. JPM 26%
6 Wal-Mart Stores WMT 31%
7 ConocoPhillips COP 51.5%
8 Berkshire Hathaway Inc. BRK 28%
9 IBM IBM 24%
10 Microsoft Corporation MSFT 22.8%
11 Philip Morris International Inc. PM 29.5%
12 Goldman Sachs GS 33%
14 Comcast Corporation CMCS 32%
14 The Procter & Gamble Co. PG 23.5%
15 Johnson & Johnson JNJ 23.7%
16 Intel Corporation INTC 23.6%
17 Occidental Petroleum Corp. OXY 42%
18 UnitedHealth Group UHG 35.9%
19 The Walt Disney Company DIS 32.7%
20 AT&T T 27.8%
21 Oracle ORCL 21.4%
22 The Coca-Cola Company KO 23.1%
23 The Home Depot Inc. HD 37.2%
24 McDonald’s MCD 32.4%
25 Google GOOG 19.4%