carly fiorina photoCarly Fiorina is currently a candidate for President of the United States of America. She is campaigning for the nomination of the Republican Party to run in the general election of 2016. According to her, one of her strengths is her business background. Most notable she speaks of her background as the first CEO of a DOW30 company: Hewlett-Packard [stckqut]HPQ[/stckqut].

This site is purposefully non-political. While I tend to be a conservative and have voted for a Republican candidate more times than not, I do not want this site to reflect my personal political thoughts. I will occasionally point out a law or regulation that is tough on investors or the business community, but success at investing must be an apolitical activity. In fact, I have written that investors should probably ignore politics and political turmoil when investing.

I am writing this article simply to analyze the success of Ms. Fiorina or the lack thereof. I am fairly hard on companies and their management. It takes a lot to make my Watch List, and most companies cannot achieve that level of performance. I doubt that HP would have made that list while Ms. Fiorina was CEO, and it certainly cannot make that list today.

donald trump photoIronically, her record at HP is one of the criticisms of Ms. Fiorina. Donald Trump is famous for criticizing her as a failed CEO, and he often cites the writings of Jeffrey Sonnenfeld. It is virtually impossible to compare the success of Donald Trump as CEO with Ms. Fiorina as CEO since Mr. Trump’s businesses are not public entities while most of Ms. Fiorina’s career has been with public entities. It is possible to dig into Ms. Fiorina and see just how lousy she was as the leader of a massive corporation.

I will point out that there is an incredibly different scale in Ms. Fiorina’s career with Mr. Trump’s career. It is unlikely that in 1999-2005 (the time when Ms. Fiorina was CEO of HP) that Mr. Trump’s combined businesses would have cracked the Fortune 500 in revenue. In comparison, Ms. Fiorina was in the DOW30, which the Dow Jones company creates to give the best representation of the overall health of the stock market. In other words, Ms. Fiorina was in the big leagues while Mr. Trump was making a lot of personal money in the minor leagues.

So how did Carly Fiorina do as CEO?

It is probably best to take a look at her critics. Mr. Trump is fairly light on details, but he cites Mr. Sonnenfeld, so let’s look at his criticisms as revealed in Politico.

  • In the five years that Fiorina was at Hewlett-Packard, the company lost over half its value.
  • During those years, stocks in companies like Apple and Dell rose.
  • Google [stckqut]GOOG[/stckqut] went public, and Facebook [stckqut]FB[/stckqut] was launched.
  • The S&P 500 yardstick on major U.S. firms showed only a 7 percent drop.
  • At a time that devices had become a low margin commodity business, Fiorina bought for $25 billion the dying Compaq computer company, which was composed of other failed businesses.
  • The only stock pop under Fiorina’s reign was the 7 percent jump the moment she was fired following a unanimous board vote.
  • Fiorina countered that she wasn’t a failure because she doubled revenues. That’s an empty measurement.
  • She hasn’t had another CEO position since her time at HP

Let’s look at each of these accusations.

In the five years that Fiorina was at Hewlett-Packard, the company lost over half its value.

This is true and is a great reason that it was probably foolish to purchase the stock of HP in that time period. However, to accurately gauge the failure we must look at the reasonable peer group of HP. I contend that the reasonable peer group was Dell, Apple [stckqut]AAPL[/stckqut], Oracle [stckqut]ORCL[/stckqut], IBM [stckqut]IBM[/stckqut], Cisco [stckqut]CSCO[/stckqut], and EMC [stckqut]EMC[/stckqut]. I choose this group for several reasons. They are all quite large and, for the most part, they got their revenue at that time from either selling personal computers or from selling large and complicated systems to the IT departments of major companies.

Unfortunately, Google Finance only shows a weekly price for that long ago. While Ms. Fiorina joined HP on July 19, 1999, and left on February 9, 2005, those dates are not exactly available on Google Finance. The exact dates may be available on other sources but using Google Finance makes it easy for my readers to play with the dates as well as throw in other comparison companies.

HP comparison chart


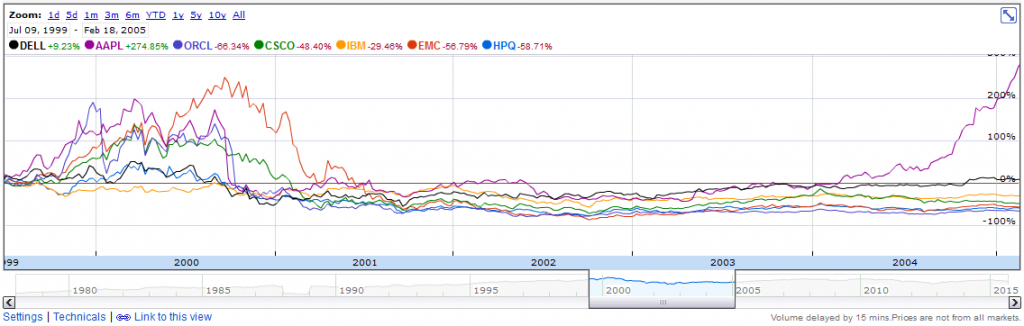
If we look at the above chart it goes from July 9, 1999, to February 18, 2005. This is a very close approximation to Ms. Fiorina’s joining and departure dates. A quick appraisal shows that only Apple and Dell increased in value during this time frame. The other companies decreased in stock value, and most of them decreased in the same approximate range as HP.

In fact, you can see that several of these companies, including HP, had peak prices shortly after Ms. Fiorina joined HP. Many of the companies had significantly bigger drops than HP during the period. If we move the start date to March 2, 2000, you will see that most of these large enterprise-IT sellers had much larger drops in stock value than HP. Obviously, this was a major challenging time for companies that sold in the same market as HP. Even Apple dropped over 70% by the end of 2000. Remember, Apple at this time was not the amazing gadget, phone and entertainment content seller of today, but instead a computer company that was quite reliant on selling personal computers.Read More →

One of the biggest challenges in investing in the stock market is picking the best stocks. In my book, “The Confident Investor” I teach my readers how to pick Good Companies. This page is designed to show the raw performance of these companies. It is not designed to show my personal portfolio, which may or may not exceed the performance stated here. Since I use the trading system described in my book, you can assume that I beat the performance recorded here.

I have created three tables below. The first table is the general market – NASDAQ and S&P500. Every investor should try to beat the average of these to indexes. In this report, my larger Watch List beats this metric easily.

I must caution you, I do not actually propose that you “buy and hold” any given stock, but rather you should “buy to hold” the stock. My investing technique teaches you to efficiently move your money to the stocks that are currently increasing in value the most. I use my Watch List for this work, these are Good Companies that I wait for great buying opportunities. This strategy is well described in my book, “The Confident Investor” and tends to be a very safe strategy in bear markets while typically still providing above market returns in a bull or flat market.

My Short Term Watch List are 15 companies that are hot right now. I select this list every quarter. I evenly divide a portion of my portfolio among these 15 companies. The next quarter, I add or delete companies as necessary and then re-balance the portfolio. This tends to be a more risky strategy because I don’t bail out on bad stock movement (at least until the end of the quarter). In a bull market or a flat market, these very well-run and high-performing companies tend to beat the general market by a significant margin.

BL-TCI-cover
You can purchase my book wherever books are sold such as AmazonBarnes and Noble, and Books A Million. It is available in paperback as well as e-book formats for NookKindle, and iPad.

Stock Indexes Performance

1 week ago 1 month ago 1 quarter ago 1 year ago
Index Close Profit % Close Profit % Close Profit % Close Profit
^GSPC $1,931.34 1.04% $1,921.22 1.57% $2,076.78 -6.04% $1,967.90 -0.84%
^IXIC $4,686.50 0.45% $4,683.92 0.51% $5,009.21 -6.02% $4,475.62 5.19%

Week average for Indexes: 0.75%
Month average for Indexes: 1.04%
Quarter average for Indexes: -6.03%
Year average for Indexes: 2.17%

Watch List Performance

1 week ago 1 month ago 1 quarter ago 1 year ago
Stock Close Profit % Close Profit % Close Profit % Close Profit
AAPL $114.71 -3.77% $109.27 1.02% $125.87 -12.31% $97.95 12.70%
ABMD $95.11 -5.06% $93.82 -3.75% $65.21 38.48% $24.71 265.44%
ADS $259.30 3.88% $250.50 7.52% $295.72 -8.92% $251.86 6.94%
AKAM $70.55 -0.45% $72.58 -3.24% $69.91 0.46% $59.74 17.56%
ALXN $149.25 11.27% $171.98 -3.44% $185.22 -10.34% $177.98 -6.69%
AZPN $38.13 0.24% $38.16 0.16% $45.49 -15.98% $36.80 3.86%
BCPC $61.23 0.83% $57.37 7.62% $56.41 9.45% $54.95 12.36%
BLK $302.98 0.13% $294.24 3.10% $342.98 -11.55% $319.20 -4.96%
BWLD $196.75 -1.61% $196.61 -1.54% $161.92 19.55% $137.11 41.19%
CBI $40.84 -5.04% $43.02 -9.86% $49.81 -22.14% $54.07 -28.27%
CBPO $83.23 11.34% $94.40 -1.83% $115.42 -19.71% $53.69 72.60%
CERN $60.71 1.04% $59.83 2.52% $68.48 -10.43% $59.80 2.58%
CFX $30.43 -2.43% $36.35 -18.32% $45.54 -34.80% $58.08 -48.88%
CMI $110.52 -2.32% $118.00 -8.51% $130.36 -17.18% $131.87 -18.13%
COF $74.05 -1.59% $74.83 -2.62% $87.89 -17.09% $80.86 -9.88%
CRUS $31.03 2.74% $29.37 8.55% $33.66 -5.29% $20.61 54.68%
DDD $12.17 -7.89% $12.72 -11.87% $18.95 -40.84% $43.53 -74.25%
DECK $58.28 1.25% $62.72 -5.92% $73.75 -19.99% $94.36 -37.46%
EOG $72.79 5.87% $76.89 0.22% $85.50 -9.87% $95.83 -19.58%
EXR $76.27 0.79% $70.83 8.52% $66.86 14.98% $50.05 53.59%
FB $92.77 -0.75% $88.26 4.32% $87.29 5.48% $77.44 18.89%
FOSL $56.95 -2.76% $59.74 -7.30% $71.78 -22.85% $97.68 -43.30%
GOOG $611.97 2.44% $600.70 4.36% $523.40 19.78% $575.28 8.97%
GPOR $31.01 0.13% $32.57 -4.67% $38.36 -19.06% $51.49 -39.70%
GTN $12.63 2.53% $11.26 15.01% $15.81 -18.09% $8.26 56.78%
GWR $60.41 1.54% $63.71 -3.72% $75.84 -19.12% $92.23 -33.49%
HOG $53.88 1.99% $54.47 0.88% $55.71 -1.37% $58.21 -5.59%
HP $47.09 4.65% $52.25 -5.68% $67.00 -26.45% $87.00 -43.36%
JAH $51.28 -2.81% $50.90 -2.08% $51.75 -3.69% $39.93 24.83%
JPM $61.03 -0.36% $61.06 -0.41% $67.04 -9.29% $58.71 3.58%
LULU $52.58 -2.78% $65.68 -22.17% $65.18 -21.57% $42.07 21.51%
LVS $41.65 -1.87% $46.92 -12.90% $53.09 -23.01% $59.61 -31.44%
MCK $192.23 -2.96% $192.82 -3.26% $223.94 -16.70% $198.68 -6.11%
MEI $32.17 0.90% $32.12 1.06% $27.31 18.86% $36.64 -11.42%
MET $47.23 -0.55% $47.86 -1.86% $55.78 -15.80% $51.89 -9.48%
MIDD $108.00 -0.75% $108.11 -0.85% $114.75 -6.59% $88.22 21.50%
MNST $136.23 -1.69% $134.24 -0.23% $133.60 0.25% $92.03 45.53%
MRK $49.60 1.09% $51.15 -1.97% $57.18 -12.31% $58.03 -13.59%
NFLX $102.24 3.79% $98.79 7.41% $94.04 12.83% $65.65 61.63%
PCLN $1,252.76 1.03% $1,245.25 1.64% $1,143.07 10.73% $1,141.46 10.88%
REGN $490.67 -2.36% $499.99 -4.18% $511.08 -6.26% $361.60 32.49%
RGLD $47.48 2.27% $45.63 6.42% $62.02 -21.71% $63.57 -23.61%
SAM $217.48 -2.93% $208.27 1.36% $227.80 -7.33% $217.72 -3.04%
SBUX $57.99 0.16% $54.28 7.00% $54.09 7.37% $37.43 55.17%
STZ $129.82 -0.54% $127.52 1.25% $116.80 10.55% $86.46 49.34%
SWKS $87.77 -4.23% $83.37 0.83% $104.56 -19.60% $54.82 53.35%
THRM $43.95 4.32% $44.51 3.01% $55.03 -16.68% $43.56 5.26%
TMO $122.65 1.50% $121.02 2.87% $130.79 -4.82% $120.82 3.04%
TRN $24.09 -4.61% $26.39 -12.92% $25.68 -10.51% $40.85 -43.74%
UA $103.71 -3.34% $95.00 5.53% $84.59 18.51% $67.84 47.77%
ULTA $169.15 -2.00% $157.70 5.11% $156.23 6.10% $116.20 42.65%

Week average for Watch List stocks: 0.00% and profit percentage increase over same period for average indexes is: -99.37%
Month average for Watch List stocks: -0.94% and profit percentage increase over same period for average indexes is: -190.23%
Quarter average for Watch List stocks: -7.17% and profit percentage increase over same period for average indexes is: 19.01%
Year average for Watch List stocks: 10.80% and profit percentage increase over same period for average indexes is: 396.82%

Short Term Watch List

1 week ago 1 month ago 1 quarter ago 1 year ago
Stock Close Profit % Close Profit % Close Profit % Close Profit
AAPL $114.71 -3.77% $109.27 1.02% $125.87 -12.31% $97.95 12.70%
ABMD $95.11 -5.06% $93.82 -3.75% $65.21 38.48% $24.71 265.44%
EXR $76.27 0.79% $70.83 8.52% $66.86 14.98% $50.05 53.59%
JAH $51.28 -2.81% $50.90 -2.08% $51.75 -3.69% $39.93 24.83%
MCK $192.23 -2.96% $192.82 -3.26% $223.94 -16.70% $198.68 -6.11%
MNST $136.23 -1.69% $134.24 -0.23% $133.60 0.25% $92.03 45.53%
NFLX $102.24 3.79% $98.79 7.41% $94.04 12.83% $65.65 61.63%
REGN $490.67 -2.36% $499.99 -4.18% $511.08 -6.26% $361.60 32.49%
STZ $129.82 -0.54% $127.52 1.25% $116.80 10.55% $86.46 49.34%
SWKS $87.77 -4.23% $83.37 0.83% $104.56 -19.60% $54.82 53.35%
THRM $43.95 4.32% $44.51 3.01% $55.03 -16.68% $43.56 5.26%
TSCO $83.97 3.39% $83.19 4.36% $90.13 -3.67% $61.45 41.28%
TTWO $30.06 -2.23% $28.45 3.30% $27.40 7.26% $22.86 28.57%
UA $103.71 -3.34% $95.00 5.53% $84.59 18.51% $67.84 47.77%
ZBRA $78.08 0.83% $79.14 -0.52% $112.43 -29.97% $70.61 11.50%

Week average for Short Term Watch List stocks: -1.06% and profit percentage increase over same period for average indexes is: -241.88%
Month average for Short Term Watch List stocks: 1.41% and profit percentage increase over same period for average indexes is: 36.07%
Quarter average for Short Term Watch List stocks: -0.40% and profit percentage increase over same period for average indexes is: -93.33%
Year average for Short Term Watch List stocks: 48.48% and profit percentage increase over same period for average indexes is: 2130.50%

Total Execution Time: 42.792463064194 Sec

This information was calculated on Oct 04, 2015 and is based on the closing value of the most recent trading day which may not be today.
This information is based on the Yahoo Historical Pricing and is only as good or as current as that data.