ID-100203460The beginning of the year is when it seems like every financial website puts out its top or worst stocks. In that vein, I offer my 15 recommended stocks for 2014 – or at least the first half of the year. I cannot list the worst stocks, as there are too many of those to list. I can at least list the 15 recommended stocks that will give you a good basis for the first half of 2014.

Many sites do all year lists, but I am only committing to this list for the first 6 months. There is a great reason for this. It is almost impossible to predict the market farther out than 6 month. In fact, it is quite possible for the market to do a massive correction and even this list would be a fallacy. There is always some risk with any investment and you are encouraged to read this site’s disclaimer before acting on this list.

I would expect all of these companies to maintain their status as Good Companies on my Watch List. I would not expect all of them to make a top 15 recommended stocks list at the end of June. Some of them will grow a bit slower than I expect, and a couple of the 15 recommended stocks are probably going to lose money. As Peter Lynch famously said:

“In this business if you’re good, you’re right six times out of ten. You’re never going to be right nine times out of ten.”

By Peter’s standards, I hope to right on this list with 9 of these picks. I don’t expect all 15 recommended stocks to be massive growth stocks in the year. I also think the list is successful if the list of 15 beats the S&P 500 and the Dow30. In July, perhaps I will publish a list for the second half of the year.

If we would go back in time (starting from December 1) and buy the 15 recommended stocks 3 years ago our portfolio would have grown very nicely. These stocks would have appreciated by 73.35% year over year. They would have grown 184.79% over the last three years. These stocks would have beaten the market (as measured by the Dow Jones Industrial Average) for the last three years by 330.57%. In the past year, these stocks would have beaten the market by 212.17%. With that track record, we should expect good results in the next 6 months.

All of the stocks on this list are rated as Good Companies using the method that I describe in my book The Confident Investor.  You can purchase my book wherever books are sold such as AmazonBarnes and Noble, and Books A Million. It is available in e-book formats for NookKindle, and iPad.

The 15 recommended stocks were chosen from Good Companies on my Watch List. This means we already know they are fairly well managed and have a history of solid growth. While all of the stocks on the Watch List are Good Companies, these 15 recommended stocks seem to be the most well setup for aggressive growth in the first half of 2014.

The 15 recommended stocks for the first half of 2014 also performed very well over the past year and the past 3 years. As I have written before, the past is not a perfect indicator of the future, but it is probably the best indicator that we have to use.

I didn’t try overly hard to make this list of 15 recommended stocks to be a balanced portfolio covering multiple industries. I am happy to report that it isn’t a terrible unbalance. The most glaring omission is that it is very light in banking and in consumer technology. I simply could not find a banking stock that was worth the risk compared to other industries. Also, the consumer technology vertical is simply not performing that well right now. I anticipate that trend to continue for the next few months at least.

It might be possible to criticize this list by its heavy reliance on healthcare and retail. That would be fair but, once again, I wasn’t trying to get a perfectly balanced portfolio.

If you want a more balanced portfolio, you may want to consider some of the Honorable Mention stocks at the end of the list. Also, I always maintain that you should have approximately 30% of your portfolio invested in index funds. These funds should be divided by large and small cap funds, an index bond fund, and an index international fund. This would help to balance your portfolio.

You could also look at the Watch List of stocks. These stocks have shown that they are well-run companies. If you are concerned about a balanced portfolio, I suggest that you compliment the 15 recommended stocks with a couple stocks from the Watch List.

The list of 15 recommended stocks for the first half of 2014

  • ABMD
  • ALXN
  • BCPC
  • BLK
  • BWLD
  • CBI
  • CERN
  • GPOR
  • PCLN
  • QCOR
  • SAM
  • TMO
  • TSCO
  • UA
  • ULTA

Read More →

Company name Boston Beer Co Inc
Stock ticker SAM
Live stock price [stckqut]SAM[/stckqut]
P/E compared to competitors Fair

MANAGEMENT EXECUTION

Employee productivity Good
Sales growth Good
EPS growth Good
P/E growth Good
EBIT growth Good

ANALYSIS

Confident Investor Rating Good
Target stock price (TWCA growth scenario) $239.95
Target stock price (averages with growth) $203.61
Target stock price (averages with no growth) $133.57
Target stock price (manual assumptions) $198.53

The following company description is from Google Finance: http://www.google.com/finance?q=sam

The Boston Beer Company, Inc. (Boston Beer) is a craft brewer in the United States. During the year ended December 31, 2011, Boston Beer sold approximately 2.5 million barrels of its products (core brands) and brewed or packaged approximately 13,000 barrels under contract (non-core brands) for third parties. During 2011, the Company sold over fifty beers under the Samuel Adams or the Sam Adams brand names, seven flavored malt beverages under the Twisted Tea brand name, three hard cider beverages under the Angry Orchard brand name and one hard cider under the HardCore brand name. Boston Beer produces malt beverages and hard cider at Company-owned breweries and under contract arrangements at other brewery locations. The Company-owned breweries are located in Boston, Massachusetts (the Boston Brewery), Cincinnati, Ohio (the Cincinnati Brewery) and Breinigsville, Pennsylvania (the Pennsylvania Brewery). During 2011, the Company launched the Angry Orchard brand family.


Confident Investor comments: At this price and at this time, I think that a Confident Investor can confidently invest in this stock.

If you would like to understand how to evaluate companies like I do on this site, please read my book, The Confident Investor.

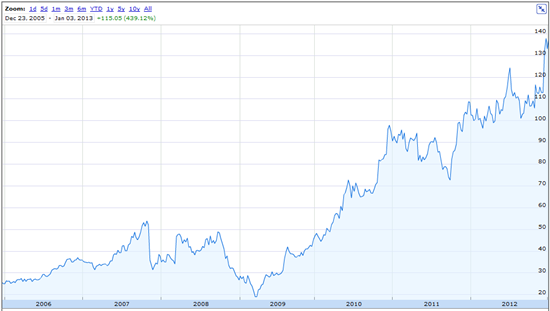
In a 7 year time frame from January 3, 2006 to December 31, 2012, Boston Beer [stckqut]SAM[/stckqut] increased 433.4% if you would have implemented a pure buy-and-hold strategy. If you would implemented the strategy that I explain in my book, The Confident Investor, you would have seen a 550.6% return on your investment. This is a 27.0% increase on the profit percentage.

To put it into actual dollars, suppose you invested $10,000 in SAM on 1/3/2006. With the system that is explained in The Confident Investor, you would have exited the market on 12/31/2012 with $77,006.32. With my system, it is not uncommon for you to need a bit more cash available to cover the ongoing trades. Therefore, rather than $10,000, you would have needed $11,836.98. You would have 502 shares which were purchased with other people’s money and still have your original $10,000.

To be fair in our comparison, the buy-and-hold method if calculated with $11,836.98 would have ended up with $63,136.04 and a respectable 433.4%. You would have purchased 473 shares but your original $11,836.98 would be tied up in the stock.

The profit on the buy-and-hold strategy in this scenario is $51,299.72.  The profit using GOPM (Grow on Other People’s Money) is $65,170.64.  That means the increased profit on SAM in this time frame was $13,870.92. This means your profit INCREASED by 27.0%!!

Understanding buy-and-hold is easy. You have a given amount of money, in this case $11,836.98. You buy 473 shares at the start of the test period. At the end of the test period, you sell the shares and the profit (or loss) is the standard that any other system must beat.

Understanding GOPM is a bit more complicated without reading my book, The Confident Investor. Before you even start to invest, the system teaches you to look for incredibly well-run companies and only invest in those companies. While SAM may or may not have qualified for this status in 2006, it does in 2013 so we are simply back-testing against a currently well-run company. While past performance doesn’t guarantee future performance, it is probably the best tool that we have to understand investment methodologies.

After you find a well-run company, you are going to buy $10,000 worth of shares when the technical indicators tell you that the stock has upward momentum. You are then going to sell those shares when that momentum slows down or reverses.  The profit that you make on that transaction, you will keep in the stock (in other words, you are not going to sell those shares). You are going to keep the $10,000 ready for when the stock has the correct momentum. If there is any excess profit (e.g. less than the value of a full share after keeping the $10,000) you will just stick that into your money-market account in this example. It is possible that you could invest this excess amount but we are going to simplify this example and just hold that money.

As a quick example, you invest $10,000 in a stock trading at $50 per share so you have purchased 200 shares.  Over the course of the next several days or weeks, the stock price increases to $55 which is where you decide to sell. To get your original capital of $10,000 back, you sell 182 shares resulting in $10,010 in your account and 18 shares that are essentially free since they were purchased with Other People’s Money. You now have your original capital of $10,000, 18 free shares and an additional $10.

Using this technique, you will make several trades per year and may even be trading weekly. Therefore, to make this model fair, I need to account for stockbroker fees and commissions.  In this example, I am using $8 for every sell and for every purchase. You may have a better fee from your favorite broker but $8 seems fair for a test. Frankly, if you are paying more than $10 for each transaction then you probably need to be looking at another broker!

Using this technique, by the end of the test on 12/31/2012 you would have 502 shares of SAM that cost you $1,836.32. Those 502 shares were acquired for $3.658 per share! This is significantly cheaper than today’s stock price and no matter what happens to SAM you could probably sell these shares for a profit at any time! You would still have the original $10,000 in your bank account! This is because you have purchased these share with Other People’s Money.  This is why I call my system GOPM – Grow on Other People’s Money.

If you would have invested in Boston Beer as described in this article, you would have doubled your investment by August 14, 2009. By that date, you would have acquired 255 shares of SAM which were valued at about $39.78 for a total profit of $10,142.63. This means your $10,000 initial investment would have doubled.

The rest of this article shows each buy and sell transaction for those 7 years. It shows the date, the assumed purchase price on that day (taken from Yahoo – the purchase price is the average of the opening and closing price on that day) and the profit or loss. If you haven’t read my book, The Confident Investor, then you may not understand the timing of the trades. In fact, if you haven’t purchased the book and registered here on this site as a book owner then you won’t be able to see those individual trades. If you have registered and cannot see the trades, make sure you are logged in and refresh your browser.

Which brings me to the big set of questions. Shouldn’t you own this book? Does your investment strategy beat buy-and-hold? Do you even have an investment strategy? If your strategy beats buy-and-hold, does it beat GOPM – Growing on Other People’s Money?

You can purchase my book wherever books are sold such as Amazon, Barnes and Noble, and Books A Million. It is available in ebook formats for Nook, Kindle, and iPad. It may be available at your favorite bookstore as well but you may have to ask.

SAM 6 year chart from Google Finance

SAM chart


[s2If current_user_can(s2member_level1)]

Description of SAM trades table

While it may be obvious the meaning of the various columns, some of them definitely need a bit of explanation if you have never walked through a trading analysis with me.

Date – The date of the trade. It is important to note the long delays between trades. This will help you with your portfolio since you do not have to dedicate your average trade purchase (in this case $10,000) to just one stock but rather you can invest that money in the hottest stock at the time.

Buy/Sell – This is probably pretty obvious. On this date, did the system buy or sell the stock? The SELL will only sell from the previous transaction’s BUY.

Purch. Price – The selling or buying price of this transaction. This is taken from Yahoo’s Historical Pricing page and it is the average of the opening and closing price on that day.

Shares purchased – The number of shares that $10,000 will buy on that day.

Invested – The amount that was actually purchased. This is the number of shares (the previous column) multiplied by the Purch. Price column.

Returned – When you sell the shares from the previous BUY, the amount of money that results.

Profit/Loss – How much was profited from the previous BUY.

Free shares – If the SELL was profitable, how many shares was evenly divides into this profit.  These are free shares as they were purchased with Other People’s Money.

Excess – After the Free Shares are taken out, how much money is left over. If the transaction was not profitable, then what was the loss.

Running investment balance – A running total of the value of the investment.


SAM trades table


Date Action Purchase price Shares purchased Invested Returned Profit / Loss Free shares Excess Running investment balance
01/19/06 BUY 26.055 383 9979.065 0
01/25/06 SELL 26.03 9961.49 -17.575 -17.575 -17.575
02/15/06 BUY 26.12 382 9977.84 -17.575
02/22/06 SELL 25.875 9876.25 -101.59 -101.59 -119.165
02/27/06 BUY 25.93 385 9983.05 -119.165
03/06/06 SELL 26.275 10107.875 124.825 4 19.725 -99.44
03/08/06 BUY 26.525 376 9973.4 -99.44
03/16/06 SELL 26.935 10119.56 146.16 5 11.485 -87.955
03/23/06 BUY 27.205 367 9984.235 -87.955
03/27/06 SELL 26.905 9866.135 -118.1 -118.1 -206.055
04/05/06 BUY 27.23 366 9966.18 -206.055
04/10/06 SELL 26.92 9844.72 -121.46 -121.46 -327.515
04/19/06 BUY 27.27 366 9980.82 -327.515
04/27/06 SELL 27.1 9910.6 -70.22 -70.22 -397.735
05/03/06 BUY 27.24 366 9969.84 -397.735
05/08/06 SELL 27.095 9908.77 -61.07 -61.07 -458.805
05/31/06 BUY 26.82 372 9977.04 -458.805
06/05/06 SELL 26.71 9928.12 -48.92 -48.92 -507.725
06/20/06 BUY 27.04 369 9977.76 -507.725
07/13/06 SELL 29.005 10694.845 717.085 24 20.965 -486.76
07/31/06 BUY 29.09 343 9977.87 -486.76
08/29/06 SELL 31.54 10810.22 832.35 26 12.31 -474.45
09/15/06 BUY 33.625 297 9986.625 -474.45
09/22/06 SELL 33.51 9944.47 -42.155 -42.155 -516.605
10/11/06 BUY 33.1 301 9963.1 -516.605
11/01/06 SELL 36.01 10831.01 867.91 24 3.67 -512.935
11/22/06 BUY 35.71 279 9963.09 -512.935
11/28/06 SELL 35.695 9950.905 -12.185 -12.185 -525.12
11/29/06 BUY 35.785 279 9984.015 -525.12
12/15/06 SELL 36.465 10165.735 181.72 4 35.86 -489.26
03/20/07 BUY 34.315 291 9985.665 -489.26
03/28/07 SELL 33.62 9775.42 -210.245 -210.245 -699.505
05/08/07 BUY 34.2 292 9986.4 -699.505
06/07/07 SELL 38.09 11114.28 1127.88 29 23.27 -676.235
06/14/07 BUY 39.63 252 9986.76 -676.235
06/22/07 SELL 39.255 9884.26 -102.5 -102.5 -778.735
07/03/07 BUY 40.19 248 9967.12 -778.735
07/18/07 SELL 41.155 10198.44 231.32 5 25.545 -753.19
08/02/07 BUY 42.275 236 9976.9 -753.19
08/14/07 SELL 43.99 10373.64 396.74 9 0.83 -752.36
08/17/07 BUY 46.75 213 9957.75 -752.36
09/07/07 SELL 47.21 10047.73 89.98 1 42.77 -709.59
09/19/07 BUY 47.185 211 9956.035 -709.59
09/21/07 SELL 47.33 9978.63 22.595 0 22.595 -686.995
09/28/07 BUY 48.83 204 9961.32 -686.995
10/19/07 SELL 52.72 10746.88 785.56 14 47.48 -639.515
02/04/08 BUY 37.695 265 9989.175 -639.515
02/15/08 SELL 37.235 9859.275 -129.9 -129.9 -769.415
02/27/08 BUY 37.27 268 9988.36 -769.415
07/08/08 SELL 41.06 243 9977.58 -769.415
07/15/08 BUY 40.86 9920.98 -56.6 -56.6 -826.015
07/21/08 SELL 41.69 239 9963.91 -826.015
08/04/08 BUY 44.845 10709.955 746.045 16 28.525 -797.49
08/12/08 SELL 45.475 219 9959.025 -797.49
08/20/08 BUY 45.045 9856.855 -102.17 -102.17 -899.66
09/16/08 SELL 45.3 220 9966 -899.66
10/01/08 BUY 46.795 10286.9 320.9 6 40.13 -859.53
04/08/09 SELL 22.955 435 9985.425 -859.53
05/28/09 BUY 28.24 12276.4 2290.975 81 3.535 -855.995
06/03/09 SELL 29.525 338 9979.45 -855.995
06/10/09 BUY 29.48 9956.24 -23.21 -23.21 -879.205
06/25/09 SELL 29.06 343 9967.58 -879.205
07/07/09 BUY 29.74 10192.82 225.24 7 17.06 -862.145
07/15/09 SELL 29.89 334 9983.26 -862.145
07/17/09 BUY 29.825 9953.55 -29.71 -29.71 -891.855
07/23/09 SELL 29.81 335 9986.35 -891.855
08/28/09 BUY 40.09 13422.15 3435.8 85 28.15 -863.705
10/21/09 SELL 38.76 257 9961.32 -863.705
10/28/09 BUY 39.095 10039.415 78.095 1 39 -824.705
11/06/09 SELL 39.855 250 9963.75 -824.705
12/07/09 BUY 42.97 10734.5 770.75 17 40.26 -784.445
12/18/09 SELL 45.175 221 9983.675 -784.445
01/15/10 BUY 48.32 10670.72 687.045 14 10.565 -773.88
02/18/10 SELL 47.185 211 9956.035 -773.88
03/12/10 BUY 49.975 10536.725 580.69 11 30.965 -742.915
03/23/10 SELL 52.165 191 9963.515 -742.915
04/26/10 BUY 57.01 10880.91 917.395 16 5.235 -737.68
05/11/10 SELL 58.79 169 9935.51 -737.68
05/20/10 BUY 58.665 9906.385 -29.125 -29.125 -766.805
05/27/10 SELL 63.295 157 9937.315 -766.805
06/22/10 BUY 72.565 11384.705 1447.39 19 68.655 -698.15
07/09/10 SELL 69.74 143 9972.82 -698.15
07/15/10 BUY 69.48 9927.64 -45.18 -45.18 -743.33
07/23/10 SELL 70.51 141 9941.91 -743.33
07/29/10 BUY 70.65 9953.65 11.74 0 11.74 -731.59
09/08/10 SELL 67.475 148 9986.3 -731.59
09/22/10 BUY 67.965 10050.82 64.52 0 64.52 -667.07
10/15/10 SELL 68.59 145 9945.55 -667.07
12/29/10 BUY 97.255 14093.975 4148.425 42 63.715 -603.355
02/04/11 SELL 93.055 107 9956.885 -603.355
02/09/11 BUY 92.3 9868.1 -88.785 -88.785 -692.14
02/15/11 SELL 93.925 106 9956.05 -692.14
02/22/11 BUY 94.325 9990.45 34.4 0 34.4 -657.74
03/03/11 SELL 94.3 105 9901.5 -657.74
03/09/11 BUY 88.45 9279.25 -622.25 -622.25 -1279.99
03/31/11 SELL 91.99 108 9934.92 -1279.99
04/08/11 BUY 92.065 9935.02 0.1 0 0.1 -1279.89
04/19/11 SELL 91.9 108 9925.2 -1279.89
05/02/11 BUY 93.52 10092.16 166.96 1 73.44 -1206.45
06/21/11 SELL 87.17 114 9937.38 -1206.45
07/27/11 BUY 90.955 10360.87 423.49 4 59.67 -1146.78
10/10/11 SELL 83.11 120 9973.2 -1146.78
11/15/11 BUY 98.385 11798.2 1825 18 54.07 -1092.71
12/01/11 SELL 100.265 99 9926.235 -1092.71
01/03/12 BUY 107.29 10613.71 687.475 6 43.735 -1048.975
02/06/12 SELL 104.615 95 9938.425 -1048.975
02/09/12 BUY 102.715 9749.925 -188.5 -188.5 -1237.475
02/22/12 SELL 102.55 97 9947.35 -1237.475
03/22/12 BUY 100.135 99 9913.365 -1237.475
04/04/12 SELL 104.075 10295.425 382.06 3 69.835 -1167.64
05/02/12 BUY 107.215 93 9970.995 -1167.64
05/16/12 SELL 105.825 9833.725 -137.27 -137.27 -1304.91
06/06/12 BUY 106.64 93 9917.52 -1304.91
07/09/12 SELL 118.135 10978.555 1061.035 8 115.955 -1188.955
09/28/12 BUY 112.535 88 9903.08 -1188.955
10/01/12 SELL 108.25 9518 -385.08 -385.08 -1574.035
10/19/12 BUY 109.195 91 9936.745 -1574.035
10/22/12 SELL 107.855 9806.805 -129.94 -129.94 -1703.975
11/02/12 BUY 113.79 87 9899.73 -1703.975
11/12/12 SELL 112.045 9739.915 -159.815 -159.815 -1863.79
12/14/12 BUY 131.19 76 9970.44 -1863.79
12/27/12 SELL 135.215 10268.34 297.9 2 27.47 -1836.32

[/s2If]

Many readers have reached out to me to ask about how to run a balanced portfolio. This article is designed to help you with general guidelines for developing such portfolio. A balanced portfolio should be 20-40% in index funds and 60-80% in individual stocks spread out among many industries. This allows you to have exposure to the general market, the international market, and the growth of truly well-run companies. The proportion of money between index funds and individual companies should be dictated by your age and how soon you will need the money to pay for life’s expenses.

The first thing to do is invest 20 to 40% of your portfolio in index funds. Divide these index funds into at least four categories:

  • international funds
  • bonds funds
  • small-cap or mid-cap funds
  • large-cap funds

I suggest that you balance your fund investments equally every year. This means that you would have 5% of your portfolio in each fund category. You may have to annually add money from the individual stock 80% of your portfolio to maintain at least 20% index fund exposure.

It really doesn’t matter which company manages the index fund you choose. There is some variation in international funds since they can track many different markets so you may need to study a bit for that component. There is little true variation in bonds funds so just find one that tracks the Barclays Capital Aggregate Bond Index. For the stock index funds, they should track one of the S&P indexes or one of the Russell indexes.

If you are over 65 then you may want to start dropping down to 60% of your portfolio being in individual stocks and 40% index funds. You definitely want to consider this if you are over 75 years of age. However, if you are under 65 then you probably should have a portfolio of stocks that is approximately 80% of your portfolio. At 65 you may think you need to be more cautious but there is a high probability that a 65 year-old person is going to live to be 90. If you have reached the glorious age of 75 then you are even more likely to live to 90.  With 25-45 more years of spending to do, you really need your money to continue to grow even if you are retired. As you approach 80 or 90 years, you may want to have a more even mix of stocks, bonds, and money-market cash. To understand this better, check out my whitepaper, Retire In Luxury.

Divide 80% of your portfolio into equal allotments that are larger than $5,000 per allotment. You should have at least 10 allotments in a balanced portfolio. You could have 20 or 30 allotments depending on the size of your portfolio. If you do not have $50,000 to divide 10 ways then divide your existing portfolio into $5,000 increments. You will find that you are much more efficient and profitable if you invest $5,000 or more using GOPM. If you have fewer than 10 allotments, be very diligent about getting a good mix of industries so that you are not overly hurt by any one trend.

Regardless of the number of allotments that you choose, you need to choose twice that number in stocks that you are tracking.  So if you have 10 allotments, you should track 20 stocks. This allows you to always have a stock that is rising to invest your money. Invariably, some of your tracked stocks will be going sideways or down but by tracking double the number you need, you are likely to have 10 that have upward momentum.

You should plan on investing in 10 to 30 companies at a time using the tools that I show in The Confident Investor. Grow your investment in any individual stock until you have doubled your money using GOPM (Grow on Other People’s Money).

When you have doubled your money in half of your companies, you may want to consider changing your allocation size to a larger allocation. This will allow you to continue to grow your investment in those great companies.

It is also possible to stop investing in any given company at half of an allotment or twice allotment depending on how you feel about that company. You should also factor the number of companies in the same industry you already having a portfolio. For instance, if you have 2 companies in nearly every industry except you only have one mining company, feel free to allow that mining company to grow to a double allotment. Similarly, if you have 3 software companies in your portfolio then you may want to limit one or all of them to a half allotment so that your portfolio is not overweight in that category.

Let me show you an example of a 50-year-old man (we will call him Bob) that has been able to save $150,000 in his IRA account.

  • $7,500 in an international index fund
  • $7,500 in a bond fund
  • $7,500 in a small-cap  or a mid-cap fund
  • $7,500 in a large-cap fund
  • $120,000 divided into 10 allotments of $12,000 each.  This means that Bob will purchase up to $12,000 in any stock on the 20 possibilities.

For the 20 stocks, Bob chose the following from the Confident Investor Watch List:

Apple Inc. Technology – Personal
Akamai Technologies Technology – Internet
Ansys, Inc. Technology – Enterprise Software
Atlas Pipeline Energy
Caterpillar, Inc. Manufacturing – Machinery
Chipotle Mexican Retail – Restaurant
Cirrus Logic Technology – Semiconductor
Deckers Outdoor Footwear
Ebay Inc. Retail – Web
Extra Space Storage Real Estate
Goldcorp Inc. Mining – Gold
Google Inc. Advertising – Web
Hms Holdings Corp Healthcare – Services
Helmerich & Payne Energy
Merck & Co., Inc. Pharmaceutical
Net Servicos de Comunicacao Telecommunications – International
Priceline.com Inc. Retail – Web
Boston Beer Alcohol Beverages
Washington Banking Finance
Yum! Brands, Inc. Retail – Restaurant

Bob will invest in these companies as indicated by the technical indicators described in my book, The Confident Investor.  You can purchase my book wherever books are sold such as Amazon, Barnes and Noble, and Books A Million. It is available in ebook formats for Nook, Kindle, and iPad.

Company name Boston Beer Co Inc
Stock ticker SAM
Live stock price [stckqut]SAM[/stckqut]
P/E compared to competitors Good

MANAGEMENT EXECUTION

Employee productivity Good
Sales growth Fair
EPS growth Good
P/E growth Poor
EBIT growth Good

ANALYSIS

Confident Investor Rating Good
Target stock price (TWCA growth scenario) $178.24
Target stock price (averages with growth) $160.71
Target stock price (averages with no growth) $112.63
Target stock price (manual assumptions) $145.47

The following company description is from Google Finance: http://www.google.com/finance?q=sam

The Boston Beer Company, Inc. (Boston Beer) is a craft brewer in the United States. During the year ended December 31, 2011, Boston Beer sold approximately 2.5 million barrels of its products (core brands) and brewed or packaged approximately 13,000 barrels under contract (non-core brands) for third parties. During 2011, the Company sold over fifty beers under the Samuel Adams or the Sam Adams brand names, seven flavored malt beverages under the Twisted Tea brand name, three hard cider beverages under the Angry Orchard brand name and one hard cider under the HardCore brand name. Boston Beer produces malt beverages and hard cider at Company-owned breweries and under contract arrangements at other brewery locations. The Company-owned breweries are located in Boston, Massachusetts (the Boston Brewery), Cincinnati, Ohio (the Cincinnati Brewery) and Breinigsville, Pennsylvania (the Pennsylvania Brewery). During 2011, the Company launched the Angry Orchard brand family.


Confident Investor comments: At this price and at this time, I think that a Confident Investor can confidently invest in this stock.